|
 |
|
Dokumentation
|
|
|
Februar 2009
|
| |
Energigrænser for vækst: 2 artikler af Richard Heinberg.
Bemærk: Der vil komme en 3. artikel.
Antiklerne er gengivet efter tilladelse fra Richard Heinberg og må ikke anvendes til kommercielle formål.
#201: The Conservation Imperative: Energy Limits to Growth and the Path to Sustainability
MuseLetter 201/January 2009 by Richard Heinberg
Download printable pdf version here (PDF, 214 KB)
Dear readers: This issue of MuseLetter is Part I of a brief series of articles about energy alternatives, net energy, and the best options for an energy transition. Later this spring the articles will be published as a booklet by Post Carbon Institute and the International Forum on Globalization.
You are no doubt keenly aware that the economy is and will be the matter of overwhelming concern for the coming year (or years), for policy makers as well as for most nearly every individual and family. Following this current project, my research and writing will be devoted to identifying strategies that can help families and communities adapt to the new economic conditions while laying the groundwork for a truly sustainable society.
Executive summary
This report is intended as a non-technical overview of the prospects for known energy sources to supply society’s energy needs at least up to the year 2100. It serves as a layperson’s introduction to the concept of net energy, or energy returned on energy invested (EROEI). It also discusses energy transition scenarios, showing why many that have been published up to this time are overly optimistic because they do not address all of the relevant limiting factors to the expansion of alternative energy sources. Finally, it shows why energy conservation (using less) and humane, gradual population reduction must be key strategies to achieving sustainability.
Overview
The world’s current energy regime is unsustainable. This is the explicit conclusion of the International Energy Agency, and it is also the substance of a wide and growing public consensus ranging across the political spectrum. One broad segment of this consensus is concerned more about the climate impacts of society’s reliance on fossil fuels; the other is moved more by questions regarding the security of future supplies of these fuels—which, as they deplete, are increasingly concentrated in only a few countries.
To say that our current energy regime is unsustainable means that it cannot continue and must therefore be replaced with something else. However, replacing the energy infrastructure of modern industrial societies is no trivial matter. Decades have been spent building the current oil-coal-gas infrastructure, and trillions of dollars invested. Moreover, if the transition from current energy sources to alternatives is wrongly managed, consequences could be severe: there is an undeniable connection between per-capita levels of energy consumption and economic well-being (see Robert Ayres and Benjamin Warr, Two Paradigms of Production and Growth). A failure to supply sufficient energy, or energy of sufficient quality, could undermine our global economic future.
It is a commonly held assumption that alternative energy sources capable of substituting for conventional fossil fuels are readily available, whether fossil (tar sands or oil shale), nuclear, or renewable. All that is necessary is to invest sufficiently in them, and life will go on essentially as it is.
But is this really the case? Energy sources have varying characteristics. And it is the characteristics of our present energy sources (principally oil, coal, and natural gas) that have enabled the creation of a society with high mobility, large population, and high economic growth rates. Will alternative energy sources perpetuate this kind of society?
While it is possible to point to innumerable successful alternative energy production installations within modern societies (ranging from small home-scale photovoltaic systems to large "farms" of three-megawatt wind turbines), it is not possible to point to the example of an entire modern industrial society obtaining the bulk of its energy from sources other than oil, coal, and natural gas. The energy transition is still more theory than reality.
But if current primary energy sources are unsustainable, this implies a daunting problem. The transition to alternative sources must occur, or the world will lack sufficient energy to maintain basic services.
Thus it is vitally important that energy alternatives be evaluated thoroughly according to relevant criteria, and that a staged plan be formulated and funded for a systemic societal transition away from oil, coal, and natural gas and toward the alternative energy sources deemed most fully capable of supplying economic benefits similar to those of conventional fossil fuels.
Many readers will probably assume that this has already been done adequately. After all, it is possible to assemble a bookshelf (as this author has done) filled with reports from nonprofit environmental organizations and books from energy analysts, dating from the early 1970s to the present, all attempting to illuminate alternative energy pathways for the United States and the world as a whole. These plans and proposals vary in breadth and quality, but especially in their success at identifying limiting factors that could prevent specific alternative energy sources from adequately replacing conventional fossil fuels.
A limiting factor that is most frequently omitted from energy transition plans is net energy, or energy return on energy invested (EROEI). One reason for its omission is, as we shall see in more detail below, that it suffers from lack of standard measurement practices. Nevertheless, for the purposes of large-scale and long-range planning, net energy may be the single most important criterion for evaluating energy sources.
This report is not intended to serve as an authoritative analysis of available energy options, nor as a comprehensive plan for a nation-wide or global transition from fossil fuels to alternatives. While such analyses and plans are needed, they will require institutional resources and ongoing re-assessment to be of value. The goal here is simply to identify the primary criteria that should be used in such analyses and plans, with special emphasis on net energy, and to offer a cursory look at some currently available data on alternative energy sources, so as to provide a general, preliminary sense of whether such alternative sources are up to the job of replacing fossil fuels—and if not, what should be the fall-back plan of governments and the other responsible institutions of modern society.
As we will see, this preliminary survey yields the disturbing conclusion that all alternative energy sources are subject to limits of one kind or another, and that there is no clear scenario in which the energy from conventional fossil fuels can be replaced with energy from alternative sources without (1) enormous investment, (2) significant time for build-out, and (3) significant sacrifices in terms of energy quality and reliability.
Thus there is a strong likelihood that neither conventional fossil fuels nor alternative energy sources can reliably be counted on to provide the amount and quality of energy that will be needed to sustain economic growth—or even current levels of economic activity—during the remainder of the current century.
This preliminary conclusion in turn suggests that a sensible transition energy plan will have to emphasize energy conservation above all. It also raises questions about the sustainability of growth per se, both in terms of human population numbers and economic activity.
Limiting Factors: Energy Evaluation Criteria
In evaluating energy sources, it is essential first to give attention to the criteria being used. Some criteria merely give us information about an energy source’s usefulness for specific applications: for example, an energy source (like oil shale) that is a solid and has low energy density per unit of weight and volume is unlikely to be a good transport fuel unless it can first somehow profitably be turned into a liquid fuel with higher energy density. Other criteria offer essential information about the suitability of an energy source for powering large segments of an entire society: micro-hydro power, for example, can be environmentally benign, but simply cannot be scaled up to provide a significant portion of the national energy budget of the US or other industrial countries.
In general, society will be better off with energy sources that have high economic utility, that are capable of being scaled up to produce large quantities of energy, and that have minimal environmental impacts.
Economic utility and scalability are determined by, among other things, energy density, the nature and quantity of other resources needed in order to employ the energy source in question, and the size of the resource base. Economist Douglas Reynolds, in a paper discussing the energy density of energy sources (which he terms "energy grade"), writes:
Higher-grade energy resources have more potential for being productive than lower grade energy resources. Energy is the driving force behind industrial production and is indeed the driving force behind any economic activity. However, if an economy's available energy resources have low grades, i.e. low potential productivity, then new technology will not be able to stimulate economic growth as much. On the other hand, high-grade energy resources could magnify the effect of technology and create tremendous economic growth. High-grade resources can act as magnifiers of technology, but low grade resources can dampen the forcefulness of new technology. This leads to the conclusion that it is important to emphasize the role of the inherent nature of resources in economic growth more fully. (Should EROEI be the most important criterion our society uses to decide how it meets its energy needs?)
But economic utility is not the only test an energy source must meet. If there is anything to be learned from the ongoing and worsening climate crisis, it is that the environmental impacts of energy sources must be taken very seriously indeed. The world cannot afford to replace oil, coal, and gas with other energy sources capable of posing a survival challenge to future generations.
Here then, are some primary energy evaluation criteria. The first three together define energy density.
Weight density refers to the amount of energy that can be derived from a standard weight unit of an energy resource. For example, if we use the British Thermal Unit (Btu) as a measure of energy and the pound as a measure of weight, coal has about 12 thousand Btu per pound, natural gas about 10 thousand Btu per pound, and oil almost 20 thousand Btu per pound. However, an electric battery typically is able to store and deliver only about 100 Btu per pound, and this is why electric batteries are problematic in transport applications: they are very heavy in relation to their energy output. Thus electric cars tend to have limited driving ranges and electric aircraft (which are quite rare) are able to carry only one or two people.
Consumers and producers are willing to pay a premium for energy resources with a higher energy density by weight; therefore it makes economic sense in some instances to convert a lower-density fuel such as coal into a higher-density fuel such as synthetic diesel, even though the conversion process entails both monetary and energy costs.
Volume density refers to the amount of energy that can be derived from a given volume unit of an energy resource (e.g., Btu per cubic foot). Obviously, gaseous fuels will tend to have lower volumetric energy density than solid or liquid fuels. Natural gas has about one thousand Btu per cubic foot at sea level atmospheric pressure, and 177 thousand Btu per cubic foot at 3000 pounds per square inch. Oil, though, can deliver about one million Btu per cubic foot.
In most instances weight density is more important than volume density; however, for certain applications the latter can be decisive. For example, fueling airliners with hydrogen, which is a highly diffuse gas at common temperatures and surface atmospheric pressure, would require very large tanks; indeed, this would be true even if the hydrogen were super-cooled and highly pressurized.
The greater ease of transporting a fuel of higher volume density is reflected in the fact that oil moved by tanker is traded globally in large quantities, while the global tanker trade in natural gas is relatively small. Consumers and producers are willing to pay a premium for energy resources of higher volumetric density.
Area density expresses how much energy can be obtained from a given land area (e.g., an acre) when the energy resource is in its original state. For example, the area energy density of wood as it grows in a forest is roughly 1 to 5 billion Btu per acre. The area grade for oil is usually tens or hundreds of billions of Btu per acre where it occurs, though oilfields are much rarer than forests (except perhaps in Saudi Arabia).
Area energy density matters because energy sources that are already highly concentrated in their original form generally require less investment and effort to be put to use. Reynolds makes the point:
If the energy content of the resource is spread out, then it costs more to obtain the energy, because a firm has to use highly mobile extraction capital [machinery], which must be smaller and so cannot enjoy increasing returns to scale. If the energy is concentrated, then it costs less to obtain because a firm can use larger-scale immobile capital that can capture increasing returns to scale.
Thus energy producers will be willing to pay an extra premium for energy resources that have high area density—such as oil that will be refined into gasoline—over ones that are more widely dispersed—such as corn that is meant to be made into ethanol.
Other resources needed: A very few energy sources come in an immediately useable form; for example, without exerting effort or employing any technology we can be warmed by the sunlight that falls on our shoulders on a spring day. But most energy sources, in order to be useful, require some method of gathering or converting the energy. That usually entails some kind of apparatus, made of some kind of material (for example, oil-drilling equipment is made from steel and diamonds); and sometimes the extraction or conversion process uses some resource (for example, the production of ethanol from corn requires land, and the production of synthetic diesel fuel from tar sands requires water and natural gas). The amount or scarcity of the material or resource, and the complexity and cost of the apparatus, thus constitute limiting factors on energy production.
The requirements for ancillary resources in order to produce a given quantity of energy are largely reflected in the price paid for the energy. But this is not always the case. For example, thin-film photovoltaic panels use materials (such as gallium and indium) that are non-renewable, rare, and depleting quickly. While the price of thin-film PV panels reflects and includes the current market price of these exotic materials, it does not give indication of future limits to the scaling up of thin-film PV.
Environmental impacts: Virtually all energy sources entail environmental impacts, but some have greater impacts than others. These may occur during the acquisition of the resource (in mining coal, for example), or during the release of energy from the resource (as in burning wood, coal, oil, or natural gas), or in the conversion of energy from one form to another (as in converting the kinetic energy of flowing water into electricity via a dam and hydro-turbines).
Some environmental impacts are indirect, and occur in the manufacture of the equipment used in energy harvesting or conversion. For example, the extraction and manipulation of resources used in manufacturing wind turbines or solar panels may entail significantly more environmental damage than the operation of the turbines or panels themselves.
Renewability. If we wish our society to continue using energy at industrial rates of flow not just for years or even decades into the future, but for centuries, then we will require energy sources that can be sustained more or less indefinitely. Energy resources like oil, natural gas, and coal are clearly non-renewable because the time required to form them through natural processes is measured in the tens of millions of years, while quantities available will power society reliably for only a few decades into the future at current rates of use. In contrast, solar photovoltaic and solar thermal energy sources rely on sunlight, which for practical purposes is not depleting and will presumably be available in equal quantities a thousand years hence.
It is important to note, however, that the equipment used to capture solar or wind energy is not itself renewable, and that both depleting raw materials and non-trivial amounts of energy are required to manufacture such equipment.
Some energy sources are renewable yet are still capable of being depleted. For example, wood can be harvested from forests that regenerate themselves; however, the rate of harvest is crucial: if over-harvested, the trees will be unable to re-grow quickly enough and the forest will shrink and disappear.
Even energy sources that are renewable and that do not suffer depletion are nevertheless limited by the size of the resource base (as will be discussed next).
Potential size or scale of contribution. Estimating the potential contribution of an energy source is obviously essential for macro-planning purposes, but such estimates are always subject to error—which can sometimes be enormous. With fossil fuels, amounts that can be reasonably expected to be extracted and used on the basis of current extraction technologies and fuel prices are classified as reserves, which are always a mere fraction of resources (defined as the total amount of the substance present in the ground). For example, the US Geological Survey’s first estimate of national coal reserves, completed in 1907, identified 5000 years’ worth of supplies. In the decades since, most of those reserves have been reclassified as resources, so that today only 250 years’ worth of US coal supplies are officially estimated to exist—a figure that may still be much too optimistic. Reserves are downgraded to resources when new limiting factors are taken into account, such as (in the case of coal) seam thickness and depth, chemical impurities, and location of the deposit.
On the other hand, reserves can sometimes grow as a result of the development of new extraction technologies, as has occurred in recent years with US natural gas supplies. While the production of conventional American natural gas is declining, new underground fracturing technologies have enabled the recovery of gas from low-porosity rock, significantly increasing the national production rate and expanding US gas reserves.
Reserves estimation is especially difficult when dealing with energy resources that have little or no extraction history. This is the case, for example, with methane hydrates, with regard to which various experts have issued a very wide range of estimates of both total resources and extractable future supplies; it is also true of oil shale, and to a lesser degree tar sands, which have limited extraction histories.
Estimating potential supplies of renewable resources such as solar and wind power is likewise problematic, as many limiting factors are often initially overlooked. With regard to solar power, for example, a cursory examination of the ultimate resource is highly encouraging: the total amount of energy absorbed by Earth’s atmosphere, oceans, and land masses from sunlight annually is approximately 3,850,000 exajoules (EJ)—whereas the world’s human population uses currently only about 428 EJ of energy per year from all sources combined, an insignificant fraction of the previous figure. However, the factors limiting the amount of sunlight that can potentially be put to work for humanity are numerous, as we will see in more detail below.
Consider the case of methane harvested from municipal landfills. In this instance, using the resource provides an environmental benefit: methane is a more powerful greenhouse gas than carbon dioxide, so harvesting and burning landfill gas (rather than letting it diffuse into the atmosphere) reduces climate impacts while also providing a local source of energy. If landfill gas could power the US electrical grid, then the nation could cease mining and burning coal. However, the potential size of the landfill gas resource is woefully insufficient to support this. Currently the nation derives about 400 trillion Btu per year from landfill gas for commercial, industrial, and electric utility uses. This figure could probably be quadrupled if more landfills were tapped. But US electricity consumers use over twenty-five times as much energy as that. There is another wrinkle: if society were to become more environmentally sensitive and energy efficient, the result would be that the amount of trash going into landfills would decline—but this would reduce the amount of energy that could be harvested from future landfills.
Location of the resource. The fossil fuel industry has long faced the problem of "stranded gas"—natural gas reservoirs that exist far from pipelines and that are too small to justify building pipelines to access them. Renewable resources often face similar hurdles.
The location of solar and wind installations is largely dictated by the availability of the primary energy source; often, this is in sparsely populated areas. For example, in the US there is large potential for the development of wind resources in Montana and North and South Dakota. However, these are some of the least-populous states in the nation. There are also good wind resources offshore along the Atlantic and Pacific coasts, nearer to large urban centers, but taking advantage of these resources will entail overcoming challenges having to do with building and operating turbines in deep water and connecting them to the grid onshore. Similarly, the nation’s best solar resources are located in the Southwest, far from population centers in the Northeast.
Thus taking advantage of these energy resources will require more than merely the construction of wind turbines and solar panels: much of the US electricity grid will need to be reconfigured, and large-capacity, long-distance transmission lines will need to be constructed.
Reliability. Some energy sources are continuous: coal can be fed into a boiler at any desired rate, as long as the coal is available. But some energy sources, such as wind and solar, are subject to rapid and unpredictable fluctuations. Wind often blows at greatest intensity at night, when electricity demand is lowest; the sun shines for the fewest hours per day during the winter—but consumers are unwilling to curtain electricity usage during winter months, and power system operators are required to assure security of supply throughout the day and year.
Intermittency of energy supply can be managed to a certain extent through storage systems—in effect, batteries. However, this implies extra infrastructure costs as well as energy losses. It also places higher demands on control technology. In the worst instance, it means building electricity generation capacity much larger than would otherwise be needed. (See: Wind: intermittent Power: continuous)
Transportability of energy is largely determined by the weight and volume density of the energy source, as discussed above. But it is also affected by the state of the material—whether it is a solid, liquid, or gas. In general, a solid fuel is less convenient to transport than a gaseous fuel, because the latter can move by pipeline. Liquids are the most convenient of all because they take up less space than gases.
Some energy sources cannot be classified as solid, liquid, or gas. The energy from sunlight or wind cannot be directly transported; it must first be converted into a form that can—such as hydrogen or electricity.
Electricity is highly transportable, as it moves through wires, enabling it to be delivered not only to nearly every building in industrial nations, but to many locations within each building.
Transporting energy always entails costs—whether it is the cost of hauling coal (which may account for over 70 percent of the delivered price of the fuel), the cost of building and maintaining pipelines and pumping oil or gas, or the cost of building and maintaining an electricity grid. These costs can be expressed in monetary terms or in energy terms.
The energy costs of transporting energy affect net energy—which we will discuss next in a separate section because it is such an important aspect of the overall discussion, and because it will be a principal focus of this report.
Net Energy (EROEI)
Energy must be invested in order to obtain energy, regardless of the nature of the energy resource or the technology used to obtain it, and society relies on the net energy gained from energy-harvesting efforts to operate all of its manufacturing, distribution, and maintenance systems.
If the net energy produced is a large fraction of total energy produced, this means that a relatively small portion of societal effort must be dedicated to energy production, and most of society’s efforts can be directed toward other purposes. This is the situation we have become accustomed to as the result of having access to cheap, abundant fossil fuels.
If the net energy produced is a small fraction of total energy produced, this means that a relatively large portion of societal effort must be dedicated to energy production, and only a small portion of society’s efforts can be directed toward other goals. For example, in a society where energy is acquired principally through agriculture—which yields a low and variable energy profit—most of the population must be involved in farming in order to provide enough energy to fund the maintenance of a small hierarchy of full-time managers, merchants, soldiers, etc., who make up the rest of the societal pyramid.
In the early decades of the fossil fuel era, the quantity of both total and net energy liberated by efforts to mine and drill for these fuels was unprecedented, and it was this abundance of cheap energy that enabled the growth of industrialization, urbanization, and globalization during the past two centuries. It took only a trivial amount of effort in exploration and drilling to obtain an enormous energy return on energy invested (EROEI). But the energy industry understandably followed the best-first or "low-hanging fruit" policy of exploration and extraction. Thus the coal, oil, and gas that were highest in quality and easiest to access tended to be found and extracted early on, and so with every passing decade the net energy (as compared to total energy) derived from fossil fuel extraction has declined. In the early days of the US oil industry, for example, a 100-to-one net energy profit was common, while it is estimated that current US exploration efforts are approaching an averaged one-to-one (break-even) energy payback.(FN Hall and Gagnon)
In addition, as we will see in some detail later in this report, alternatives to conventional fossil fuels generally have a much lower EROEI than coal, oil, or gas did in their respective heydays. For example, industrial ethanol production from corn is estimated to have at best a 1.5-to-one positive net energy balance; it is therefore nearly useless as a primary energy source.
If the net energy available to society declines, more of society’s resources will have to be devoted directly to obtaining energy, and less will be available for all of the activities that energy makes possible. Thus increasing constraints will be felt on economic growth, and also upon the adaptive strategies (which require new investment—for example: the building of more public transport infrastructure) that society would otherwise deploy to deal with energy shortages. The immediately noticeable symptoms will include rising costs of bare necessities and a reduction in job opportunities in fields not associated with basic production.
Net energy can be thought of in terms of the number of people in society engaged in energy production. If energy returned exactly equals energy invested (EROEI = 1), then everyone is involved in energy production and no one is available to take care of society’s other needs. If EROEI = 100, then one person is involved in energy production and 99 can do other things—build houses, teach, take care of the sick, cook, write advertising copy, and so on. If there are two energy workers and 98 people doing other things, then EROEI = 50; and similarly with four people obtaining energy and 96 doing other things, EROEI = 25. With 8 getting energy and 92 doing other things (EROEI = 12.5) there may begin to be problems finding enough workers who are trained at getting energy while others build the tools and infrastructure (drilling rigs or assembly lines for making solar panels) that enable these energy workers to do their jobs. With 16 getting energy and 84 doing other things (EROEI = 6.25), serious problems may become apparent, since 84 people may not be enough to provide for all of the needs of the 16, given that half of the larger group may consist of children, the elderly, and disabled persons. With 16 energy workers and 42 others providing everything else, an industrial mode of societal organization may not be viable.
Archaeologist Lynn White estimated that hunter-gatherer societies operated on a ten-to-one net energy basis (EROEI = 10). Since hunter-gatherer societies are the simplest human groups in terms of technology and degree of social organization, 10 should probably be regarded as the minimum sustained average societal EROEI required for the maintenance of human existence (though groups of humans have no doubt survived for occasional periods, up to several years in duration, of lower EROEI). Since industrial society entails much greater levels of complexity, its minimum EROEI must be substantially higher.
However, in this report we will not be discussing the EROEI of society as a whole, but of individual energy sources.
Both renewable and non-renewable sources of energy are subject to the net energy principle. Fossil fuels become useless as energy sources when the energy required to extract them equals or exceeds the energy that can be derived from burning them. This fact puts a physical limit to the portion of resources of coal, oil, or gas that should be categorized as reserves, since net energy will peak and decline to the break-even point long before otherwise extractable fossil energy reserves are depleted.
Therefore the need for society to find replacements for fossil fuels may be more urgent than is generally recognized. Even though large amounts of fossil fuels remain to be extracted, the transition to alternative energy sources must be negotiated while there is still sufficient net energy available to continue powering society while at the same time providing energy for the transition process itself.
Because this report is a layperson’s guide, we cannot address in any depth the technical process of calculating net energy. However, it is important to note that the process is complex and is subject to ongoing controversy. Most of this controversy centers on system boundaries: what should be counted as an energy cost for a specific instance of energy production? For example, should we count the energy expended in the manufacturing of shoes worn by the workers on an oilrig?
The use of net energy or EROEI as a criterion for evaluating energy sources has been criticized on several counts. As just mentioned, there is difficulty in establishing system boundaries that are agreeable to all interested parties, and that can be easily translated from analyzing one energy source to another. Moreover, the EROEI of some energy sources (such as wind, solar, and geothermal) may vary greatly according to location. Advances in technology can also affect net energy. All of these factors make it difficult to calculate figures that can reliably be used in energy planning.
This difficulty only increases as the examination of energy production processes becomes more detailed. Does the office staff of a drilling company actually need to drive to the office to produce oil? Is the energy spent filing tax returns actually necessary to the manufacture of solar panels?
Yet despite challenges in precisely accounting for the energy used in order to produce energy, net energy acts as an absolute constraint in human society, regardless of whether we ignore it or pay close attention to it. EROEI will determine if an energy source is able successfully to support a society of a certain size and level of complexity. In situations where EROEI can be determined to be low, even though there is dispute as to the exact figure, we can conclude that the energy source in question cannot be relied upon as a primary source.
Many criticisms of net energy analysis boil down to an insistence that other factors that limit the efficacy of energy sources should also be considered. EROEI does not account for limits to non-energy inputs in energy production (inputs such as water, soil, or the minerals and metals needed to produce equipment); it does not account for undesirable non-energy outputs of the energy production process—most notably, greenhouse gases; it does not account for energy quality (the fact, for example, that electricity is an inherently more versatile and useful energy medium than the muscle power of horses); and it does not reflect the scalability of the energy source (recall the example of landfill gas above).
However, just because net energy is not the only important criterion for assessing a potential energy source, this is no reason to ignore it. EROEI is a necessary—though not a sufficient—basis for evaluating energy sources. It is one of five criteria that we should regard as having make-or-break status (the others, discussed above, are renewability, environmental impact, size of the resource, and the need for ancillary materials). If a potential energy source cannot score well with all of these criteria, it cannot realistically be considered as a future primary energy source. Stated the other way around, a potential energy source can be disqualified by doing very poorly with regard to just one of these five criteria.
It should be noted, however, that an energy source with a low or negative EROEI can still be useful as a medium or carrier to make other energy sources easier to use. In an energy system with many source inputs, common energy carriers are extremely helpful. Electricity serves this function well in our current energy system: it would be difficult for consumers to make practical use of coal, nuclear, and hydropower without it. But convenient negative-EROEI energy carriers need to be connected to high-EROEI energy sources—otherwise the system cannot function.
In the following discussions of specific energy sources, data on EROEI are drawn from the work of Dr. Charles Hall, who, working with his students at the State University of New York in Syracuse, has for many years been at the forefront of developing and applying the methodology for calculating net energy.
Following this consideration of known energy sources case-by-case, we will explore the prospects for combining non-fossil sources into a workable future energy system.
2. artikel
Greetings,
Here is MuseLetter 202 for February 2009.
Best wishes,
Richard
The Conservation Imperative, Energy Limits to Growth and the Path to Sustainability - Part II: Assessing Energy Sources
While this report is focused on the prospects for alternative energy sources to replace fossil fuels, it is useful to apply the above criteria first to oil, coal, and gas so that comparisons can be made with their potential replacements.
Oil. As the world’s current primary energy source, oil fuels nearly all global transportation—cars, planes, trains, and ships (the exceptions, such as electric cars and subways, electric trains, and sailing ships, are statistically insignificant). Petroleum provides about 40 percent of total world energy, or about 40 EJ per year. The world currently uses about 74 million barrels of oil per day, or 30 billion barrels per year, and reserves amount to about one trillion barrels (though the figure is disputed).
Plus: Petroleum has become so widely relied upon because of its basic characteristics: it is highly transportable as a liquid at room temperature and is easily stored. It is energy dense (a cup of oil contains as much energy as 1 ½ lbs of wood, or 42 MJ per kilogram). Historically, oil has been cheap to produce, and easy to transport and use, and can be procured from a very small land footprint.
Minus: Oil’s downsides are as plain as its advantages.
Its environmental impacts are significant. Extraction is especially damaging in poorer nations such as Ecuador and Nigeria, where the industry tends to spend minimally on the kinds of remediation efforts that are required by law in the US; as a result, rivers and wetlands are fouled, air is polluted, and indigenous people see their ways of life threatened. Meanwhile, burning oil releases climate-changing CO2 (about 800 to 1000 lbs CO2 per barrel [13]), as well as other pollutants such as nitrogen oxides and particulates.
Oil is also non-renewable, and many of the world’s largest oilfields are already significantly depleted. Most oil-producing nations are seeing declining rates of extraction, and future sources of the fuel are increasingly concentrated in just a few countries—principally, the members of OPEC. The geographic occurrence of oil deposits has led to competition for supplies, and sometimes to war over access to the resource. As oil becomes scarcer due to depletion, even worse oil wars may occur.[14]
EROEI: The net energy (compared to gross energy) from global oil production is difficult to ascertain precisely, because many of the major producing nations do not readily divulge statistics that would make detailed calculations possible. About 750 kilojoules of energy are required to lift 15kg of oil 5 meters—an absolute minimum energy investment for pumping oil that no longer flows out of the ground under pressure. But energy is expended also in exploration, drilling, refining, and so on. A rough total number can be derived by dividing the energy produced by the global oil industry by the energy equivalent of the dollars spent by the oil industry for exploration and production. According to Hall, this number—for oil and gas together—was about 23:1 in 1992, increased to about 32:1 in 1999, and has since declined steadily, reaching 19 in 2005. If the recent trajectory is projected forward, the EROEI for global oil and gas would decline to 10:1 soon after 2010.
It is important to remember that this number is a global average: some producers enjoy much higher net energy than others. There is every reason to assume that most of the high-EROEI oil producers are OPEC-member nations.
Prospects: Oil production has peaked and is in decline in most producing countries, and nearly all of the world’s largest oilfields are seeing falling production. The all-time peak of global oil production occurred in July, 2008 at 75.1 million barrels per day. At the time, the per-barrel price had skyrocketed to its all-time high of $147. Since then, declining demand and falling price have led producing nations to cut back on pumping significantly. Declining price has also led to a significant slowing of investment in exploration and production, which virtually guarantees production shortfalls in the future. It therefore seems unlikely that the July 2008 rate of production will ever be exceeded.
Declining EROEI and limits to global oil production will therefore constrain future world economic activity unless alternatives to oil can be found.
Natural Gas was formed by geological processes similar to those that produced oil, and it often occurs together with liquid petroleum. In the early years of the oil industry, gas was simply flared (burned); today, it is regarded as a valuable energy resource and is used globally for space heating and cooking fuel; it also has many industrial uses where high temperatures are needed, and is increasingly burned to generate electricity. Of the world’s total energy, natural gas supplies 23.5 percent; global reserves amount to about 6300 trillion cubic feet, which represents an amount of energy equivalent to 890 billion barrels of oil. [15]
Plus: Natural gas is the least carbon intensive of the fossil fuels (58 kg CO2 per GJ). Like oil, natural gas is energy dense (weight density, volume density), and is extracted from a small land footprint. It is easily transported through systems of pipelines and pumps, though it cannot be transported by ship as conveniently as oil, as that typically requires pressurization.
Minus: Natural gas is a hydrocarbon fuel, which means that burning it releases CO2 even if the amounts are less than would be the case to yield a similar amount of energy from coal or oil. Like oil, natural gas is non-renewable and depleting. Environmental impacts from the production of natural gas are similar to those with oil. Recent disputes between Russia, Ukraine, and Europe over Russian natural gas supplies underscore the increasing geopolitical competition for access to this valuable resource.
EROEI: The net energy of global natural gas is even more difficult to calculate than that of oil, because oil and gas statistics are often aggregated. A recent study that incorporates both direct energy (diesel fuel used in drilling and completing a well) and indirect energy (used to produce materials like steel and cement consumed in the drilling process) found that as of 2005, the EROEI for US gas fields was 10:1. [16] However, newer "unconventional" natural gas extraction technologies (coal bed methane and production from low-porosity reservoirs using "fracing" technology) probably have significantly lower net energy yields: the technology itself is more energy intensive, and wells deplete quickly, thus requiring increased drilling rates to yield equivalent amounts of gas. Thus as conventional gas depletes and unconventional gas makes up a greater share of total production, the EROEI of natural gas production will decline, possibly dramatically.
Prospects: During the past few years, North America has averted a natural gas supply crisis as a result of the deployment of new production technologies, but it is unclear how long the reprieve will last given the low EROEI of these production techniques (and the fact that the best unconventional deposits, such as the Barnett Shales of Texas, are being exploited first). European gas production is declining and Europe’s reliance on Russian gas is increasing—but it is difficult to tell how long Russia can maintain current flow rates. In short, while natural gas has fewer environmental impacts than the other fossil fuels, especially coal, its future is clouded by supply issues and declining EROEI.
Coal was the first fossil fuel and the primary energy source of the Industrial Revolution. While it formerly was used for space heating, cooking, and various industrial processes, coal is today burned mainly for the production of electricity and for making steel. Coal has been the fastest growing energy source (by quantity) in recent years due to prodigious consumption growth in China, which is by far the word’s foremost producer and user of the fuel. The world’s principal coal deposits are located in the US, Russia, India, China, Australia, and South Africa. World coal reserves are estimated at 850 billion metric tons (though this figure is disputed), with annual production running at just over four billion tons. Coal produces 134.6 EJoules annually, or 27 percent of total world energy. The US relies on coal for 49 percent of its electricity, and 23 percent of total energy. [17] Its energy density by weight is variable (from 30 MJ/kg for high-quality anthracite to as little as 5.5 MJ/kg for lignite).
Plus: Coal currently is a cheap, reliable source of electricity. It is easily stored, though bulky. However, long-distance transport makes economic sense only for higher-quality coals.
Minus: Coal has the worst environmental impacts of the conventional fossil fuels, both in the process of obtaining the fuel (mining) and in that of burning it to release energy. Because coal is the most carbon-intensive of the conventional fossil fuels (290 kg CO2 are emitted for every GJ of energy produced), it is the primary source of greenhouse gas emissions leading to climate change, even though it contributes less energy to the world economy than petroleum does.
Coal is non-renewable, and some nations (UK and Germany) have already used up most of their original coal reserves. Even the US, the "Saudi Arabia of coal," is seeing declining production from its highest quality deposits.
EROEI: Historically, the net energy from coal was very high, at an average of 177:1 according to one study [18], but it has fallen substantially to a range of 50:1 to 85:1. Moreover, the decline is continuing, with one estimate suggesting that by 2040 the EROEI for US coal will be .5:1 [19].
Prospects: While official reserves figures suggest that world coal supplies will be sufficient for a century or more, recent studies suggest that supply limits may appear globally, and especially regionally, much sooner. According to a 2007 study by Energy Watch Group of Germany, world coal production is likely to peak around 2025 or 2030, with a gradual decline thereafter. China’s production peak could come sooner if economic growth (and hence energy demand growth) returns soon. For the US, coal production may peak in the period 2030 to 2035.
New coal technologies such as carbon capture and storage could reduce the climate impact of coal, but at a significant economic and energy cost (by one estimate, about 40 percent of the energy from coal would go toward mitigating climate impact, with the other 60 percent being available for economically useful work). Coal prices increased substantially in 2007-2009, as the global economy heated up, which suggests that the existing global coal supply system was near its limit. Prices have declined sharply since then as a result of the world economic crisis and falling energy demand. Prices for coal will almost certainly increase in the future, in inflation- or deflation-adjusted terms, as high-quality deposits are exhausted and energy demand recovers.
Tar sands, sometimes called "oil sands," consist of bitumen embedded in sand or clay. The resource is essentially petroleum that formed without an impervious geological "cap," so that lighter hydrocarbon molecules rose to the surface and volatized long ago rather than remaining trapped underground.
The material is fairly useless in its raw state, and requires substantial processing or upgrading, the finished product being referred to as "syncrude." The process can be accomplished in situ through the underground injection of steam, or in above-ground refineries after the material has been mined with giant mechanized shovels.
The sites of greatest commercial concentration of the resource are in Alberta, Canada and the Orinoco Basin of Venezuela. Current production of syncrude from operations in Canada amounts to about 1.5 million barrels per day, which accounts for 1.7 percent of total world liquid fuels production, or a little less than 0.7 percent of total world energy. Reserves amount to about 1.7 trillion barrels of oil equivalent in Canada and 235 billion barrels of extra heavy crude in Venezuela, though it is likely that a large portion of what has been classified as "reserves" should be considered unrecoverable "resources" given the likelihood that deeper and lower-quality tar sands will require more energy for their extraction and processing than they will yield.
Plus: The only advantages of tar sands over conventional petroleum are that (1) large amounts remain to be extracted, and (2) the place where the resource exists in greatest quantity (Canada) is geographically close and politically friendly to the country that imports the most oil (the US).
Minus: Tar sands have all of the negative qualities associated with the other fossil fuels (they are nonrenewable, polluting, and climate-changing), but in greater measure than is the case with natural gas or conventional petroleum. Tar sands production is the fastest-growing source of Canada’s greenhouse gas emissions, with the production and use of a barrel of syncrude ultimately doubling the amount of CO2 that would be emitted by the production and use of a barrel of conventional petroleum. Extraction of tar sands has already caused extensive environmental damage across a broad expanse of Northern Alberta.
All of the techniques used to upgrade tar sands into syncrude require other resources: some of the technologies require significant amounts of water and natural gas—as much as 4.5 barrels of water and 1200 cubic feet (34 cubic meters) of natural gas for each barrel of syncrude.
As a result, syncrude is costly to produce. A fixed per-barrel dollar cost is relatively meaningless given the recent volatility in input costs; however, it is certainly true that production costs for syncrude are much higher than historic production costs for crude oil, and compare favorably only with the higher costs for the production of a new marginal barrel of crude using expensive new technologies.
EROEI for tar sands and syncrude production is difficult to assess directly. Various past net energy analyses for tar sands range from 1.5:1 to 7:1, with the most robust and recent of analyses suggesting a range of 5.2:1 to 5.8:1. [20] This is a small fraction of the net energy historically derived from conventional petroleum, and it is likely to be insufficient to enable tar sands to serve as a primary energy source for industrial economies.
Prospects: The International Energy Agency expects syncrude production in Canada to expand to 5 mb/d by 2030, but there are good reasons for questioning this. The environmental costs of expanding production to this extent may be unbearable. Further, investment in tar sands expansion is now declining, with more than US$60 billion worth of projects having been delayed in the last three months of 2008 as the world skidded into recession. A more realistic prospect for tar sands production may be a relatively constant production rate, rising perhaps only to two mb/d.
Oil shale. If tar sands are oil that was "spoiled," oil shale (or kerogen, as it is more properly termed) is oil that was undercooked: it consists of source material that was not buried at sufficient depth or for long enough to be chemically transformed into the shorter hydrocarbon chains found in crude oil or natural gas. Deposits of potentially commercially extractable oil shale exist in 33 countries, with the largest being found in the western region of the US (Colorado, Utah, and Wyoming). Oil shale is used to make liquid fuel in Estonia, Brazil, and China; it is used for power generation in Estonia, China, Israel, and Germany; for cement production in Estonia, Germany, and China; and for chemicals production in China, Estonia, and Russia. As of 2005, Estonia accounted for about 70 percent of the world’s oil shale extraction and use. The percentage of world energy currently derived from oil shale is negligible, but world reserves are estimated at 2.8 trillion barrels of liquid fuel. [21]
Plus: As with tar sands, the only real upside to oil shale is that there is a large quantity of the resource in place. In the US alone, shale oil resources are estimated at two trillion barrels, nearly twice the amount of the world’s remaining conventional oil resources.
Minus: Oil shale suffers from low energy density, about one sixth that of coal. The environmental impacts from its extraction and burning are very high, and include severe air and water pollution and the release of half again as much CO2 as the burning of conventional oil. The use of oil shale for heat is far more polluting than natural gas or even coal.
EROEI: Reported EROEI (energy return on investments) for oil produced from oil shale are generally in the range of 1.5:1 to 4:1 [22]. Net energy for this process is likely to be lower than the production of oil from tar sands because of the nature of the material itself.
Prospects: During the past decades most commercial efforts to produce liquid fuels from oil shale have ended in failure. Production of oil shale worldwide has actually declined significantly since 1980. While low levels of production are likely to continue in several countries that have no other domestic fossil fuel resources, the large-scale development of production from oil shale deposits seems unlikely anywhere for both environmental and economic reasons.
Nuclear. Producing electricity from controlled nuclear fission reactions has long been a contentious way of providing energy for society. Currently, about 435 commercial power-generating reactors are operating worldwide, 103 of them in the US. Collectively they produce 2658 TWh world-wide, and 806 TWh in the US. This represents 3 percent of world energy, and 8 percent of all energy in the US. [23]
All commercial reactors in the US are variants of light water reactors. Other designs have been subjects of research (see below).
Plus: Nuclear electricity is reliable and relatively cheap (2.9 cents per kW/h) once the reactor is in place and operating. In the US, while no new nuclear power plants have been built in many years, the amount of nuclear electricity provided has grown during the past decade due to the increased efficiency and reliability of existing reactors.
The nuclear cycle emits much less CO2 than the burning of coal to produce an equivalent amount of energy (though uranium mining and enrichment, and plant construction still entail carbon emissions). This has led some climate protection spokespeople to favor nuclear power, at least as a temporary bridge to an all-renewable energy future.
Minus: Uranium, the fuel for the nuclear cycle, is a non-renewable resource. The peak of production is likely to occur between 2040 and 2050 [24], which means that nuclear fuel is likely to become more scarce and expensive over the next few decades. Already, the average grade of uranium has declined substantially in recent years as the best reserves have been depleted. Recycling of fuel and the employment of alternative nuclear fuels are possible, but the technology has not been adequately developed.
Nuclear power plants are so costly to build that unsubsidized nuclear plants are not economically competitive with similar-sized fossil-fuel plants. Government subsidies in the US include: 1) those from the military nuclear industry, 2) non-military government subsidies, and 3) artificially low insurance costs.
The nuclear fuel cycle entails substantial environmental impacts, which may be greater during the mining and processing stages than during plant operation even when radiation-releasing accidents are taken into account. Mining entails ecosystem removal, dust, large amounts of tailings (equivalent to 100 to 1,000 times the amount of uranium extracted), and radiation-emitting particles leaching into groundwater. During plant operation, accidents causing small to large releases of radiation can impact the local environment or much larger geographic areas, potentially making land uninhabitable (as with Chernobyl).
Storage of radioactive waste is highly problematic. High-level waste (like spent fuel) is much more radioactive and difficult to deal with than low-level waste, and must be stored onsite for several years before transferal to a geological repository.
The best-known way to deal with waste, which can contain lethal doses of radiation for thousands of years, is to store it in a geological repository, deep underground. Yucca Mountain in Nevada, the only site being investigated as a repository in the US, will begin accepting waste in 2017. More repositories will be needed, especially if the use of nuclear power is expanded in the US. Even then, over tens of thousands of years waste could possibly leak into the water table. The issue is controversial even after extremely expensive and extensive analyses by the Department of Energy.
Nearly all commercial reactors use water as a coolant. Heat pollution from coolant water discharged into lakes, rivers or oceans can disrupt aquatic habitats. In recent years, a few reactors have had to be shut down due to water shortages, highlighting a future vulnerability of this technology in a world where fresh water is becoming increasingly scarce.
Reactors must not be sited in earthquake-prone regions due to the potential for radiation release in the event of a serious quake. Nuclear reactors are often cited as potential terrorist targets and as potential sources of radioactive materials for the production of terrorist "dirty bombs."
EROEI: A review of net energy studies of nuclear power that have been published to date by Hall et al. [25] found the information to be "disparate, widespread, idiosyncratic, prejudiced, and poorly documented." The largest issue is often what the appropriate boundaries of analysis should be. The review concluded that the most reliable EROEI information is quite old, while newer information is either highly optimistic 10:1 or more) or pessimistic (low or even negative).
Prospects: The nuclear power industry is growing, with ten to twenty new power plants being considered in the US alone. But the scale of growth is likely to be constrained mostly for reasons discussed above.
Hopes for a large-scale deployment of new nuclear plants rest on the development of new technologies: pebble-bed and modular reactors, fuel recycling, and the use of thorium as a fuel. The ultimate technological breakthrough for nuclear power would be the development of a commercial fusion reactor. However, each of these new technologies is problematic for some reason. Fusion is still decades away and will require much costly research. The technology to extract useful energy from thorium is highly promising, but will require many years and expensive research and development to commercialize. The only breeder reactors in existence are closed, soon to be closed, abandoned, or awaiting re-opening after serious accidents: BN-600 (Russia, end of life 2010); Clinch River Breeder Reactor (U.S., construction abandoned in 1982 because the US halted its spent-fuel reprocessing program and thus made breeders pointless); Monju (Japan, being brought online again after serious sodium leak and fire in 1995); Superphénix (France, closed 1998). Therefore, realistically, nuclear power plants constructed in the short and medium term can only be incrementally different from current designs.
In order for the nuclear industry to grow sufficiently so as to replace a significant portion of energy now derived from fossil fuels, scores if not hundreds of new plants would be required, and soon. Given the expense and long lead time entailed in plant construction, the industry may do well merely to build enough new plants to replace old ones that are nearing retirement and decommissioning.
Hall et al. end their review of nuclear power by stating: "In our opinion we need a very high-level series of analyses to review all of these issues. Even if this is done, it seems extremely likely that very strong opinions, both positive and negative, shall remain. There may be no resolution to the nuclear question that will be politically viable."
Hydropower is electric current produced from the kinetic energy of flowing water. Water’s gravitational energy is relatively easily captured, and relatively easily stored behind a dam. Hydro projects may be enormous (as with China’s Three Gorges Dam) or very small ("microhydro") in scale. Large projects typically involve a dam, a reservoir, tunnels, and turbines; small-scale projects usually simply employ the "run of the river," harnessing energy from a river’s natural flow, without water storage.
Hydropower currently provides 2894 TWh of electricity annually worldwide, and about 264 TWh in the US, which represents 6 percent of total energy globally and 3 percent nationally. Of all electrical energy, hydropower supplies 19 percent worldwide (with 15 percent coming from large hydropower), and 6.5 percent in the US.[26]
Plus: Unlike many other energy sources, for hydropower most energy and financial investment occurs during project construction, while very little is required for maintenance and operations. Therefore electricity from hydro is generally cheaper than electricity from other sources, which may cost two to three times as much to generate.
Minus: Energy analysts and environmentalists are divided on the environmental impacts of hydropower. Proponents of hydropower see it as a clean, renewable source of energy with only moderate environmental or social impacts. Detractors of hydropower see it as having environmental impacts as large as or larger than those of some conventional fossil fuels. Global effects include carbon emissions primarily during dam and reservoir construction. Regional effects result from reservoir creation, dam construction, water quality changes, and destruction of native habitat. The amount of carbon emissions produced is very site-specific and substantially lower than from fossil fuel sources. Much of the debate centers around hydropower’s effects on society and whether or not a constant supply of water for power, irrigation, or drinking justifies the relocation of millions of people. Large dam and reservoir construction nearly always requires major relocations, and about 40-80 million people have been relocated and otherwise impacted by various associated effects of hydro projects. Dam failure or collapse is a risk in some cases, especially in China.
EROEI: The EROEI of hydropower, which ranges roughly from 11.2:1 to 267:1, is very site-specific. Because hydropower is such a variable resource, used in many different geographical conditions and involving various technologies, one generalized EROEI ratio cannot describe all projects. The EROEI for favorable or even moderate sites can be extremely high, especially if the environmental or social impacts are not included in the analysis.
Prospects: Globally, there are many undeveloped dam sites with hydropower potential, though there are far fewer in the US, where most of the best sites have already been developed. Theoretically, hydropower at some level could be accessible to any population with a constant supply of flowing water. The International Hydropower Association estimates that only about one-third of the realistic potential of world hydropower has been developed. In practice, the low investment cost of fossil fuels, and the environmental and social costs of dams, has meant that fossil fuel-powered projects are much more common.
Dams have the potential to produce a moderate amount of additional, high-quality electricity in less-industrialized countries, but are often associated with extremely high environmental and social costs. Many authors see "run-of-river" hydropower as the future, because it does away with massive relocation projects, minimizes the impacts on fish and wildlife, and does not release greenhouse gases (because there is generally no reservoir), while it retains the benefits of a clean, renewable, cheap source of energy. However, the relatively low power density of this approach limits its potential.
Wind. Wind power is one of the fastest-growing energy sources in the world, expanding more than five-fold between 2000 and 2007. However, it still accounts for less than one percent of the world’s electricity generation, and less than one percent of total energy. In the US, total production currently amounts to 32Twh, which is .77 percent of total electricity supplied, or 0.4 percent of total energy.
In the US, 35 percent of all the new electricity generation installed during 2007 (over 5,200 MW) was wind. In September 2008, the US surpassed Germany to become the world leader in wind energy production. US wind energy production has doubled in just two years. There is now more than 25,000 MW of generating capacity. (In discussing wind power, it is important to distinguish between nameplate production capacity—the amount of power that theoretically could be generated at full utilization—and the actual power produced: the former number is always much larger, because winds are intermittent and variable.) [27]
Wind turbine technology has advanced in recent years, with the capacity of the largest turbines growing from one MW in 1999 to up to 5 MW today. The nations currently leading in installed wind generation capacity are the United States, Germany, Spain, India, and China. Wind power currently accounts for about 19 percent of electricity produced in Denmark, 9 percent in Spain and Portugal, and 6 percent in Germany and the Republic of Ireland. In 2007-2008 wind became the fastest-growing energy source in Europe, in terms of quantity.
Plus: Wind power is a renewable source of energy, and there is enormous capacity for growth in wind generation: it has been estimated that developing 20 percent of the world’s wind-rich sites would produce seven times the current world electricity demand. [28] The cost of electricity from wind power, which is relatively low, has been declining in recent years. In the US as of 2006, the cost per unit of energy produced was estimated to be comparable to the cost of new generating capacity for coal and natural gas: wind cost was estimated at $55.80 per MWh, coal at $53.10/MWh and natural gas at $52.50.[29]
Minus: The uncontrolled, intermittent nature of wind reduces its value as compared to operator-controlled energy sources such as coal, gas, or nuclear power. For example, during January 2009 a high pressure system over Britain resulted in very low wind speeds combined with unusually low temperatures (and therefore higher than normal electricity demand). The only way for utility operators to prepare for such a situation is to build extra generation capacity from other energy sources. Therefore adding new wind generating capacity often does not substantially decrease the need for coal, gas, or nuclear power generation capacity; it merely enables those conventional power plants to be used less while the wind is blowing.
Since much of the wind resource base is in remote locations, getting the wind from the local point-of-generation to a potentially distant load center can be costly. The remoteness of the wind resource base also leads to increased costs for development in the case of land with difficult terrain or that is far from transportation infrastructure.
Being spread out over a significant land area, wind plants must compete with alternative uses of these land resources where multiple simultaneous usages are impossible.
The dramatic cost reductions in the manufacture of new wind turbines over the past two decades may slow as efficiencies are maximized and as materials costs increase.
EROEI: The average EROEI for all studies worldwide (operational and conceptual) was 24.6. The average EROEI for just the operational studies is 18.1. This compares favorably with conventional power generation technologies. [30]
In the US, existing wind power has a high EROEI (18:1), though problems with electricity storage may reduce this figure substantially as generating capacity grows. EROEI generally increases with the power rating of the turbine, because (1) smaller turbines represent older, less efficient technologies; (2) larger turbines have a greater rotor diameter and swept area, which is the most important determinant of a turbine’s potential to generate power, and (3) since the power available from wind increases by the cube of an increase in the wind speed, and larger turbines can extract energy from winds at greater heights, the wind speed and thus EROEI increase quickly.
The net energy ratio for wind power can range widely depending on the location of a turbine’s manufacture and installation, due to differences in the energy used for transportation of manufactured turbines between countries, the countries’ economic and energy structure, and recycling policies. For example, production and operation of an E-40 turbine in coastal Germany requires 1.39 times more energy than in Brazil.
Prospects: Wind is already a competitive source of power. For structural reasons (its long term cost of production is set by financing terms upon construction, and does not vary in the short term), it benefits from feed-in tariffs to protect it from short-term electricity price fluctuations, but overall it will be one of the cheapest sources of power as fossil fuels dwindle—and one with a price guaranteed not to increase over time. In the EU its penetration is already reaching 10 to 25 percent in several nations; prospects in the US are in some ways better, as growth is not limited by the geographical constraints and population density found in Europe.
Intermittency can be dealt with, as the European experience shows, by a combination of smart grid management and rare use of the existing fossil-fuel-fired capacity: even though a large amount of thermal power generation capacity will still be required, less coal and gas will need to be burned.
In the US, substantial further development of wind power will require significant investment in upgrading the national electricity grid.
Solar Photovoltaics (PV). Photovoltaic cells generate electricity directly from sunlight, with greater efficiency than photosynthesis does. PV solar cells most often use silicon as a semiconductor material. Since a huge amount of energy is transmitted to the earth’s surface in the form of solar radiation, tapping this source has great potential. If only 0.025 percent of this energy flow could be captured, it would be enough to satisfy world electricity demand. In 2006 and 2007, photovoltaic systems were the fastest growing energy technology in the world, increasing 50 percent annually.
The goals of PV research are to (1) increase the efficiency of the process of converting sunlight into electricity (the typical efficiency of an installed commercial single-crystalline silicon solar panel is 10 percent, while 24.7 percent efficiency has been achieved under laboratory conditions); and (2) decrease the cost of production (single-crystalline silicon panels average $3.00 per watt installed, while new photovoltaic materials and technologies, especially thin-film PV materials made by printing or spraying nano-chemicals onto an inexpensive plastic substrate, promise to reduce production costs dramatically, though usually at a loss of efficiency or durability). [31]
Plus: The solar energy captured by photovoltaic technology is renewable - and there is a lot of it. The cumulative average energy irradiating a square meter of earth’s surface for a year is approximately equal to the energy in a barrel of oil; if the sunlight could be captured at 10 percent efficiency, 3861 square miles of PV arrays would supply the energy of a billion barrels of oil. Covering the world’s estimated 360,000 square miles of building rooftops with PV arrays would generate the energy of 98 billion barrels of oil each year.
The price for new installed PV generating capacity has been declining steadily for many years. Unlike passive solar systems, PV cells can function on cloudy days.[32]
Minus: The functionality of PV power generation varies not only daily, but also seasonally with cloud cover, sun angle, and time of day. Thus, as with wind, the uncontrolled, intermittent nature of PV reduces its value as compared to operator-controlled energy sources such as coal, gas, or nuclear power. Sunlight is abundant, but diffuse: its area density is low. Thus efforts to harvest energy from sunlight are inevitably subject to costs and tradeoffs with scale.
Some of the environmental impacts of manufacturing PV systems have been analyzed by Alsema et al. and compared to the impacts of other energy technologies. [33] They have found energy pay-back times of 1.7 to 2.7 years and CO2 emissions which are greater than those found for wind energy systems, but only 5 percent of CO2 emissions from coal burning. Another potential impact is the loss of large amounts of wildlife habitat if really large industrial scale solar arrays are built, as they are likely to be, in undeveloped desert areas.
EROEI: Explicit net energy analysis of PV energy is scarce. However, using the time required for "energy pay back" and the lifetime of the system, it is possible to determine a rough EROEI. From a typical life-cycle analysis performed in 2005, Hall et al. calculated an EROEI of 3.75:1 to 10:1. [34]
Table: EROEI for various PV systems (ranging from commercially available to theoretical), calculated between 2000 and 2008. [35]

Some of these EROEI values are likely to change as research and development continue. If present conditions persist, EROEI may decline since sources of silicon for the industry are limited.
Prospects: Despite the enormous growth of PV energy, in recent years the annual increase in oil, gas, or coal production has usually exceeded total existing photovoltaic energy production. Therefore if PV is to become a primary energy source the rate of increase in capacity will need to be much greater than is currently the case.
Because of its high up-front cost, a substantial proportion of installed PV has been distributed on home roofs and in remote off-grid villages. Commercial utility-scale PV installations are now appearing in several nations, partly due to the lower price of newer thin-film PV materials and changing government policies. [36]
The current economic crisis has lowered the rate of PV expansion substantially, but that situation could be reversed if government efforts to revive the economy focus on investment in renewable energy.
However, if very large and rapid growth in the PV industry were to occur, the problem of materials shortages would have to be addressed in order to avert dramatic increases in cost. Materials in question—copper, cadmium-telluride (CdTe), and copper-indium-gallium-diselenide (CIGS)—are crucial to some of the thin-film PV materials to which the future growth of the industry (based on lowering of production costs) is often linked. With time, PV production may be constrained by lack of available materials, the rate at which materials can be recovered or recycled, or possibly by competition with other industries for those scarce materials. The only long-term solution will rest in the development of new PV materials that are common and cheap.
Active (concentrating) solar thermal. This technology typically consists of installations of mirrors to focus sunlight, creating very high temperatures heating a liquid that turns a turbine, producing electricity. The same power plant technology that is used with fossil fuels can be used with solar thermal since the focusing collectors can heat liquid to temperatures from 300°C to 1000°C. Fossil fuel can be used as a backup at night or when sunshine is intermittent.
There is a great deal of interest and research in solar thermal and a second generation of plants is now being designed and built, mostly in Spain. Worldwide capacity will soon reach 3000 MW.
Plus: Like PV energy, active solar thermal is renewable and there is enormous potential for growth. In the best locations, cost per watt of installed capacity is competitive with fossil-fuel power sources. Solar thermal benefits from using already mature power plant technology and needs less land than a photovoltaic array of the same generating capacity.
Minus: Again like PV, concentrating solar thermal power is intermittent and seasonal. Some environmental impacts are to be expected on the land area covered by mirror arrays and during the construction of transmission lines to mostly desert areas where this technology works best.
EROEI: The energy balance of this technology is highly variable depending on location, thus few studies have been done. In the best locations (areas with many sunny days per year), EROEI is likely to be quite high.
Prospects: There is considerable potential for utility-scale deployment of concentrating solar thermal power. Some energy writers have suggested that all of the world’s energy needs could be filled with electrical power generated by this technology. This would require the covering of large areas of desert in the southwestern US, northern Africa, central Asia, and central Australia with mirrors, as well as the construction of high-power transmission lines from these desert sites to places where electricity demand is highest. Such a project is possible in principle, but the logistical hurdles and financial costs would be daunting. Moreover, some intermittency problems would remain even if the sunniest sites were chosen.
Leaving aside such grandiose plans, nevertheless for nations that lie sufficiently close to the equator, this appears to be one of the most promising alternative sources of energy available. [37] Rising fossil fuel prices, renewable portfolio standards (RPSs) coming into effect in many states and an American public that is becoming increasingly interested in renewable energy sources are making it an attractive technology in the U.S.
Passive solar consists of capturing and optimizing heat and light from the sun within living spaces without the use of any collectors, pumps, or mechanical parts so as to reduce or eliminate the need for powered heating or lighting. Buildings are responsible for a large percentage of total energy usage in most countries, and so passive solar technologies are capable of offsetting a substantial portion of energy production and consumption that might otherwise come from fossil fuels. A passive solar building is designed 1) to maintain a comfortable average temperature, and 2) to minimize temperature fluctuations. It usually takes more time, money, and design effort to build, with extra costs made up in energy savings over time.
Chart: historical timeline of passive solar energy, 5th century to 2006. [38]

Passive solar buildings utilize seven main construction elements, and passive solar heating takes three dominant forms: direct gain, trombe walls, and insulated gain. Other uses of natural energy in buildings include passive solar cooling and daylighting.
Plus: Depending on the study, passive solar homes cost less than, the same as, or around 3-5 percent more than other custom homes. The extra cost will eventually pay for itself in energy savings. A solar home can only generate heat for its occupants and not extra electricity, but if used on all new houses, the system could go a long way toward replacing other fuels.
Incorporating a passive solar system into the design of a new home is generally cheaper than fitting it onto an existing home. A solar home "decreases cooling loads and reduces electricity consumption, which leads to significant decline in the use of fossil fuels." [39] Passive solar buildings, in contrast to buildings with artificial lighting, may provide a healthier, more productive work environment.
Minus: Limitations of passive solar heating include geographic location (clouds and colder regions make solar heating less effective), and sealing the house envelope to reduce air leaks means increasing the chance of pollutants becoming trapped inside. The heat-collecting equator-facing side of the house needs good sun exposure in the winter, which may require spacing houses farther apart and using more land than other types of housing.
EROEI: Passive solar design is extremely site-specific, and architects rarely get quantitative feedback on the system, so determining the EROEI is very difficult. However, if the system is built into the house from the beginning, then large energy gains can be obtained with few or no further investments.
Energy savings can range from 30 to 70 percent, so EROEI varies vastly from case to case. For example, if the payback period is five years and the house lasts for 50, then the EROI would be 10:1.
Table 1: energy savings at various locations (with date, type and size of building indicated) for the daylighting technique. [40]
Table 2: energy savings at various locations (with date, techniques, monetary savings, and cost indicated) for the passive solar heating technique.[41]

Prospects: Designing buildings from the start to take advantage of natural heating and lighting, and to use more insulation and solar mass, has tremendous potential to reduce energy demand. In many cases, new high-efficiency buildings require more energy for construction. Until now, this assumed requirement for a higher up-front investment has discouraged mass-scale construction of passive solar buildings in most countries.
Higher energy prices will no doubt gradually alter this situation, but quicker results could be obtained through shifts in building regulations and standards, as has been shown in Germany. There, the development of the voluntary Passivhaus standard has stimulated construction and retrofitting of more than 20,000 passive houses in northern Europe. [43] The Passivhaus is designed to use very little energy for heating. Passive solar provides space heating and superinsulation and air-tight construction to stop the heat from leaking out.
Buildings in the industrialized nations have generally become more efficient in recent years, however declines in averaged energy use per square foot have generally been more than offset by population growth and the overbuilding of real estate, so that the total amount of energy used in buildings has continued to increase. Thus population and economic growth patterns need to be part of the "green building" agenda. [42]
Geothermal energy is derived from the heat within the earth, which can be ‘mined’ by extracting hot water or steam, either to run a turbine for electricity generation or for direct use of the heat itself. Geothermal power can be generated in regions where tectonic plates meet and volcanic and seismic activity are common. Lower temperature geothermal direct heat can be tapped anywhere on earth by digging a few meters down and installing a tube system connected to a heat pump.
Currently, the only places being exploited for geothermal electrical power are where hydrothermal resources exist in the form of hot water or steam reservoirs. In these locations, hot groundwater is pumped to the surface from 2-3 km deep wells and used to drive turbines. Power can also be generated from hot dry rocks by pumping turbine fluid into them through 3 to 10 km deep bore holes. This method, called Enhanced Geothermal System (EGS) generation, is the subject of a great deal of research, but no power has been generated commercially using EGS.
In 2006, world geothermal power capacity was about 10 GW. [44] There is no consensus on potential resource base estimates for power generation. Hydrothermal areas that have both heat and water are rare, so the utility of most geothermal resources depends on whether EGS and other developing technologies will prove to be commercially viable. For example, a 2006 MIT report estimated U.S. hydrothermal resources at 2400 to 9600 EJ, while dry heat geothermal resources were estimated to be as much as 13 million EJ. [45]
Annual growth of geothermal power capacity worldwide has slowed from 9 percent in 1997 to 2.5 percent in 2004. However the use of direct heat using heat pumps or piped hot water has been growing 30 to 40 percent annually, particularly in Europe, Asia and Canada. [46]
Plus: Geothermal power plants produce much lower emissions and use less land area compared to fossil fuel plants. They run constantly, unlike other renewable sources such as wind and solar. Geothermal direct heat is available everywhere, although it becomes less cost-effective in temperate climates. Countries rich in geothermal resources will become less dependent on foreign energy.
Minus: In addition to geography and technology, high capital cost and low fossil fuel costs are major limiting factors for geothermal development. Technological improvements are necessary for the geothermal industry to continue to grow. Water can also be a limiting factor, since both hydrothermal and dry rock systems consume water.
The sustainability of geothermal power generating systems is a cause of concern. Geothermal resources are only renewable if heat removal is balanced by natural replenishment of the heat source. Some geothermal plants have seen declines in temperature, most probably because the plant was oversized for the local heat source.
There is likely to be some air, water, thermal and noise pollution from the building and operation of a geothermal plant, as well as solid waste buildup and the possibility of induced seismic activity nearby it.
EROEI: The net energy for electricity generation from hydrothermal resources has ranged, depending on the researcher, from 2:1 to 13:1. This discrepancy represents both the lack of a unified methodology for EROEI analysis and disagreements about system boundaries, quality-correction, and future expectation. [47]
There are no calculations of EROEI values for geothermal direct use, though for various reasons it is assumed that they are higher than those of hydrothermal resources. As a starting point, it has been calculated that heat pumps move 3 to 5 times the energy in heat that they consume in electricity.
Prospects: The limited hydrothermal resources are unlikely to become a silver bullet solution to meet increasing global energy needs, but could continue to be important regionally. If non-hydrothermal resources were to become economically feasible, much larger, less-depletable geothermal resources would be opened up worldwide, potentially increasing EROEI, geographic relevance, long-term sustainability and production of geothermal power. Geothermal heat pumps already seem to be generating net thermal energy on small scales and are nearly limitless geographically. They are most useful in regions with cold winters and hot summers since they provide both heating and cooling.
Tidal Power generation from tidal forces is geographically limited to places where there is a large movement of water as the tide flows in and out, such as estuaries, bays, headlands, or channels connecting two bodies of water.
The oldest tidal power technology, dating back to the Middle Ages when it was used to grind grain, consists of building a barrage or dam which blocks off all or most of a tidal passage. The difference in the height of water on the two sides of the barrage is used to run turbines. A newer technology, which is still in the development stage, places underwater turbines called tidal stream generators directly in a tidal current or stream.
Globally, there is about 0.3 GW of installed capacity of tidal power [48], most of it produced by the barrage built in 1966 in France across the estuary of the Rance River. One estimate of the size of the global annual potential for tidal power is 450 TWh, much of it located on the coasts of Asia, North America, and the United Kingdom. [49]
Plus: Once a tidal generating system is in place, it has low operating costs and produces reliable, although not constant, carbon-free power.
Minus: Sites for large barrages are limited to a few places around the world. They require large amounts of capital to build, and have a significant negative impact on the ecosystem of the dammed river or bay.
EROEI: No calculations have been done for tidal power EROEI as yet. For tidal stream generators this figure is likely to be close to that of wind power (an average EROEI of 18:1) since the turbine technology for wind and water is so similar that tidal stream generators have been described as "underwater windmills." Construction of barrage systems may be similar to that of dams (EROEI ~ 11.2:1 to 267:1), but they will have a somewhat lower EROEI since they only generate power for part of the tidal cycle.
Prospects: Many new barrage systems have been proposed and new sites identified, but the initial cost is a difficulty. There is often strong local opposition as with the proposed barrage for the mouth of the River Severn in the U.K. Tidal stream generators need less capital investment and if designed and sited well may have very little environmental impact. Prototype turbines and commercial tidal stream generating systems are being tested around the world.
Wave Power Electricity can be generated from wind-driven ocean waves. Some wave energy devices are designed to work offshore in deeper water, harvesting the up and down motion of the waves. Onshore systems use the force of breaking waves or the rise and fall of water to run pumps or turbines.
The commonly quoted estimate of potential global wave power generation is about 2 TW [50], distributed mostly on the western coasts of the Americas, Europe, southern Africa and Australia where wind-driven waves reach the shore after accumulating energy over long distances. For current designs of wave generators the economically exploitable resource is likely to be from 140 – 750 TWh per year. [51] The only operating commercial system is the 2.25 MW Agucadora Wave Park off the coast of Portugal.
Research in wave energy has been funded by both governments and small engineering companies and there are many prototype designs. Once the development stage is over and the price and siting problems of wave energy systems are better understood, there may be more investment in them. In order for costs to decrease, problems with resistance to corrosion and storm damage must be solved.
Plus: Once installed, wave energy devices emit negligible greenhouse gases and should be cheap to run. Since the majority of the world’s population lives near the coast, wave energy is convenient for providing electricity to many and it may also turn out to be an expensive but sustainable way to desalinate water.
Minus: In addition to high construction costs, there are concerns about the environmental impact of some designs. They may interfere with fishing grounds and navigation or cause erosion. Wave energy fluctuates seasonally as well as daily since winds are stronger in the winter, making it a somewhat intermittent energy source.
EROEI: The net energy of wave energy devices has not been thoroughly analyzed. One rough estimate of EROEI for the Portuguese Pelamis device is 15:1. [52]
Prospects: Wave power generation will need more research and development and infrastructure building before it can become widespread. More needs to be understood about the environmental impacts of wave energy farms so that destructive siting can be avoided. The best devices will need to be identified and improved, and production of wave devices will need to become much cheaper.
Biomass Wood and other kinds of traditional biomass still account annually for about 13 percent of the world’s total energy consumption and are used by up to 3 billion people for cooking and heating. [53] Nontraditional ‘new’ biomass uses generally involve converting biomass into liquid fuel, using it to generate electricity, or using it to co-generate heat and electricity. World electric power generation from biomass was about 183 TWh in 2005 from an installed capacity of 40GW, with 27 percent of this coming from biogas and municipal solid waste. [54]
Biogas is created by the biological process of decay in the absence of oxygen. Biogas emission occurs naturally in places where anaerobic decay is concentrated, like swamps, landfills, or cows’ digestive systems. Industrial manufacture of biogas uses bacteria to ferment or anaerobically digest biodegradable material, producing a combustible mixture of 50 – 75 percent methane and other gases. [55] Biogas can be used like natural gas and burned as fuel in anything from a small cookstove to an electrical plant. Small-scale biogas is utilized all over the world, both in households and for industry.
Wood fuels presently account for 60 percent of global forest production and along with agricultural residues contribute 220 GWth for cooking and heating energy. [56] Forests are a huge resource, covering 7 percent of the earth’s surface, but net deforestation is occurring around the globe, especially in South America, Indonesia and Africa. Deforestation is caused mostly by commercial logging and clearing land for large-scale agriculture, not by traditional wood gathering, which is often sustainably practiced. However in many areas, wood use and population pressure are leading to deforestation and even desertification.
Cogeneration or Combined Heat and Power (CHP) plants can burn fossil fuels or biomass to make electricity and are configured so that the heat from this process is not wasted but used for space or water heating. Biomass CHP is more efficient at producing heat than electricity, but can be practical if there is a local source of excess biomass and a community or industrial demand nearby for heat and electricity. Biomass plants are being built in the U.S., in northern Europe, and also in Brazil where they are associated with the sugar processing industry. The rate of growth of biopower has been around 5 percent per year over the last decade. [57] Biomass power plants are only half as efficient as natural gas plants and are limited in size by a fuelshed of around 100 miles, but they provide a good source of rural jobs and reliable baseload power. [58]
Another bioenergy source is biogas from waste materials, but it is difficult to find estimates of the possible size of this resource. The National Grid in the U.K. has suggested that waste methane can be collected, cleaned and added to the existing natural gas pipeline system. They estimate that if all the country’s sewage, food, agriculture and manufacturing biowastes were used, half of all U.K. residential gas needs could be met. Burning biogas for heat and cooking offers 90 percent energy conversion efficiency, while using biogas to generate electricity is only 30 percent efficient. [59]
Plus: Biomass is distributed widely where people live. This makes it well-suited for use in small-scale, region-appropriate applications where using local biomass is sustainable. In Europe there has been steady growth in biomass CHP plants in which scrap materials from wood processing or agriculture are burned, while in developing countries CHP’s are often run on coconut or rice husks. In California, dairy farms are using methane from cow manure to run their dairy operations. Biogas is used extensively in China for industry, and 25 million households worldwide use biogas for cooking and lighting. [60]
Burning biomass and biogas is considered to be carbon neutral, since unlike fossil fuels they operate within the biospheric carbon cycle. Biomass contains carbon that would be released naturally by decomposition or burning to the atmosphere over a short period of time. Using waste sources of biogas like cow manure or landfill gas reduces emissions of methane, a greenhouse gas twenty-three times more potent than carbon dioxide.
Minus: Biomass is a renewable resource but not a particularly expandable one. Often available biomass is a waste product of other human activities, such as crop residues from agriculture, wood chips, sawdust and black liquor from wood products industries and solid waste from municipal trash and sewage. In a future, less energy-intensive agricultural system, crop residues may be needed to replenish soil fertility and won’t be available for power generation. There may also be more competition for waste products as manufacturing from recycled materials increases.
Using biomass for cooking food has contributed to deforestation in many parts of the world and it is associated with poor health and shortened lifespans, especially for women who cook with wood or charcoal in unvented spaces. Finding a substitute fuel or increasing the efficiency of cooking with wood is the goal of programs in India, China and Africa. [61] In order to reduce greenhouse gas emissions, it is more desirable to re-forest than to plan to use more wood as fuel.
EROEI estimates for biomass are extremely variable. Biomass is generally more efficiently used for heat than for electricity, but electricity generation from biomass can be energetically favorable if the source is harvested sustainably or is a waste product. Biogas is usually made from waste materials and utilizes decomposition, which is a low energy-input process, so it is inherently efficient.
Prospects: Wood, charcoal and agricultural residues will continue to be used around the world for cooking and heating. There is a declining amount of biomass-derived materials entering the waste stream because of increased recycling, so the prospect of expanding landfill methane capture is declining. Use of other kinds of biogas is a potential growth area. Policies that support biogas expansion exist in India and especially in China, where there is a target of increasing the number of household-scale biogas digesters from an estimated 1 million in 2006 to 45 million by 2020.
Ethanol is an alcohol made from plant material that is first broken down into sugars and then fermented. It has had a long history of use as a transportation fuel beginning with the Model T Ford. In 2007, 13.1 billion gallons of ethanol were produced globally. Thirty-eight percent of it was produced from sugar cane in Brazil, while another 50 percent was manufactured from corn in the U.S.[62] There has been a high rate of growth in the industry, with a 15 percent annual increase in world production between 2000 and 2006. Ethanol can be substituted for gasoline, but the total quantity produced is still only a tiny fraction of the 142 trillion gallons of gasoline consumed in the U.S. each year. [63]
Ethanol can be blended with gasoline and used in existing cars in concentrations of up to 10 percent. For percentages higher than this modifications are needed since ethanol is more corrosive than gasoline. New cars are already being manufactured that run on 100 percent ethanol, on the 25/75 ethanol/gasoline ‘gasohol’ blend used in Brazil, or the 85/15 E85 blend found in the U.S.
In the U.S., corn ethanol has become controversial because of the problems associated with using a staple food plant like corn as a fuel and because ethanol plants run on fossil fuels. However there is also interest in making ethanol from non-food plant materials like corn fiber, wheat chaff or pine trees. An especially interesting potential feedstock is the native prairie plant switchgrass, which requires less fossil fuel input than corn and can yield 3 to 5 times as many gallons of ethanol per acre. However, making cellulosic ethanol out of these non-food feedstocks is a technology in its infancy and not yet commercial.
Potential ethanol resources are limited by the amount of land available to grow feedstock. According to the Union of Concerned Scientists (UCS), using all of the corn grown in the U.S. with nothing left for food or animal feed would only displace perhaps 15 percent of U.S. gasoline demand by 2025. [64] Large-scale growing of switchgrass or another new cellulose crop would require finding very large acreages to cultivate them.
Plus: Ethanol has the portability and flexibility of oil and can be used in small amounts blended with gasoline in existing vehicles. The distribution infrastructure for gasoline could be gradually switched over to ethanol with very little disruption as new cars that run on higher ethanol concentrations are phased in.
Cellulosic ethanol is promising in terms of net energy return since it can be broken down using enzymes rather than needing to be heated using coal or natural gas as is the case with corn. It also has potentially less environmental impact with respect to land use and lifecycle greenhouse gas emissions. The UCS reports that it has the potential to reduce greenhouse gas emissions by 80-90 percent compared to gasoline. [65] However there are still technical problems with producing cellulosic ethanol on a commercial scale that have not yet been solved.
Minus: There are approximately 45 MJ per kilogram contained in both the finished gasoline and crude oil, while ethanol has an energy density of about 26 MJ per kilogram and corn has only 16 MJ per kilogram. In general, this means that large amounts of corn must be grown and harvested to equal even a small portion of our gasoline consumption on an energy equivalent level, which will undoubtedly expand the land area that is impacted by the production process of corn-based ethanol.
Increases in corn ethanol production may have helped to drive up the price of corn around the world in 2007, contributing to a 400 percent rise in the price of tortillas in Mexico. [66] Ethanol and other biofuels now consume 17 percent of the world’s grain harvest.
There are climate change implications to corn ethanol production as well. If food crops are used for making transportation fuel rather than food, more land will have to go into food production somewhere else. When natural ecosystems are cleared for food or ethanol production, the result will be a ’carbon debt’ which will release 17 to 420 times more CO2 than is saved by displacing fossil fuels. [67] Corn-based ethanol, since fossil fuels are necessary for growing corn and converting it, is estimated to offer only a 10-25 percent reduction in greenhouse gas emissions compared to gasoline. [68] Corn ethanol also uses three to six gallons of water for every gallon of ethanol produced and has been shown to emit more air pollutants than gasoline.
EROEI: There is a range of estimates of this number for ethanol since EROEI depends on widely ranging variables such as the energy input required to get the feedstock, (high for corn and low for switchgrass and cellulose waste materials) and which process is used to convert it to alcohol.
There is even a geographic difference in energy input depending on how well suited the feedstock crop is to the region in which it is grown. For example, it has been reported on The Oil Drum (www.theoildrum.com) that there is a definite hierarchy of corn productivity by state. For example, in 2005, 173 bushels per acre (10859 kg/ha) were harvested in Iowa, while only 113 bushels per acre were harvested in Texas (7093 kg/ha). This is consistent with the general principle of gradient analysis in ecology, which states that individual plant species grow best near the middle of their gradient space; that is near the center of their range in environmental conditions such as temperature and soil moisture. The climatic conditions in Iowa are clearly at the center of corn’s gradient space. What is understood less is that corn production is also less energy-intensive at or near the center of corn’s gradient space. [69]
These results show diminishing returns for EROEI as the distance from Iowa increases, meaning that the geographic expansion of corn production will produce lower yields at higher costs. Ethanol production in Iowa and Texas yield very different energy balances, so that in Iowa the production of a bushel of corn costs 43 MJ, while in Texas it costs 71 MJ. Calculated EROEI’s for corn ethanol range from 1.8:1 to 1.14:1.
Ethanol from sugar cane in Brazil is calculated to have an EROEI of 8:1 to 10:1, but when made from Louisiana sugar cane in the U.S., where growing conditions are worse, the EROEI is closer to 1:1. [70] Estimates for the net energy of cellulose ethanol vary widely, from 2:1 to 36:1. [71]
Prospects: Ethanol’s future as a major transport fuel is probably dim except perhaps in Brazil, where sugar cane supplies the world’s only economically competitive ethanol industry. The political power of the corn lobby in the U.S. has kept corn ethanol subsidized and investment flowing, but its poor net energy ratio will eventually cause it to be uneconomic. The technical problems of processing cellulose for ethanol may be overcome, but land use considerations will be likely to limit the size of production.
Biodiesel. Biodiesel is a non-petroleum-based diesel fuel made by transesterification of vegetable oil or animal fat (tallow). It can be used (alone, or blended with conventional petrodiesel) in unmodified diesel-engine vehicles. Biodiesel is distinguished from the straight vegetable oil (SVO), sometimes referred to as "waste vegetable oil" (WVO), "used vegetable oil."(UVO), or "pure plant oil" (PPO). Vegetable oil can itself be used as a fuel either alone in some converted diesel vehicles, or blended with biodiesel or other fuels.
The vegetable oil used as motor fuel or in the manufacture of biodiesel is typically made from soy, rape seed ("canola"), palm, or sunflower; considerable research has been devoted to producing oil for this purpose from algae, with varying reports of success (more below). The process for making biodiesel consists of a chemical treatment of vegetable oil (transesterification) to remove glycerine, leaving long-chain alkyl (methyl, propyl or ethyl) esters.
Global biodiesel production reached about 8.2 million tons (230 million gallons) in 2006, with approximately 85 percent of biodiesel production coming from the European Union, but with rapid expansion occurring in Malaysia and Indonesia. [72]
In the United States, average retail (at the pump) prices, including Federal and state fuel taxes, of B2/B5 are lower than petroleum diesel by about 12 cents, and B20 blends are the same as petrodiesel.[73] B99 and B100 generally cost more than petrodiesel except where local governments provide a subsidy.
Plus: Biodiesel has some more favorable environmental characteristics than petroleum diesel. Through its lifecycle, biodiesel emits one fifth the CO2 of petroleum diesel, contains less sulfur and leads to longer engine life. [74] When biodiesel is made from waste materials like used vegetable oil, many of the environmental tradeoffs entailed in the production of other biofuels become non-issues.
Minus: The most negative impact of expanding biodiesel production is the need for large amounts of land to grow oil crops. Palm oil is the most fruitful oil crop, producing 13 times the amount of oil as soybeans, the most-used biodiesel feedstock in the U.S. In Malaysia and Indonesia, rainforest is being cut to plant palm oil plantations and it has been estimated that it will take 100 years for the climate benefits of biodiesel production from each acre of land to make up for the CO2 emissions from losing the rainforest. [75] Palm oil production (for food as well as fuel) is driving deforestation across Southeast Asia and reducing rainforest habitat to the point where larger species, such as the orangutan, are threatened with extinction. [76] Soybean farming in Brazil is already putting pressure on Amazon rainforests. If soybeans begin to be used extensively for biofuels this pressure will increase.
EROEI: The first comprehensive analysis of the full life cycles of soybean biodiesel and corn grain ethanol shows that biodiesel has much less of an impact on the environment and a much higher net energy benefit than corn ethanol, but that neither can do much to meet U.S. energy demand. [77]
The researchers tracked all the energy used for growing corn and soybeans and converting the crops into biofuels. They also looked at how much fertilizer and pesticide corn and soybeans required and how much greenhouse gases and nitrogen, phosphorus, and pesticide pollutants each released into the environment.
"Quantifying the benefits and costs of biofuels throughout their life cycles allows us not only to make sound choices today but also to identify better biofuels for the future," said Jason Hill, a postdoctoral researcher in the department of ecology, evolution, and behavior and the department of applied economics and lead author of the study. [78]
The study showed that both corn grain ethanol and soybean biodiesel produce more energy than is needed to grow the crops and convert them into biofuels. This finding refutes other studies claiming that these biofuels require more energy to produce than they provide. The amount of energy each returns differs greatly, however. Soybean biodiesel returns 93 percent more energy than is used to produce it, (1.93:1) while corn grain ethanol currently provides only 25 percent more energy. Other researchers have claimed that the net energy of soybean biodiesel has improved over the last decade because of increased efficiencies in farming, and calculated net energy at 3.5:1. [79] Palm oil biodiesel has the highest net energy, perhaps as high as 9:1. [80]
Prospects: Biodiesel can also be made from algae, which in turn can be grown on waste carbon sources, like the CO2 scrubbed from coal-burning power plants or sewage sludge. This is an intriguing possibility, but is still in a developmental stage. Limiting factors may be the need for large tanks, water, sunshine and thermal protection in cold climates. Saltwater rather than freshwater can be used to grow the algae, and there is optimism that this technology can be used to produce significant amounts of fuel. [81]
There are concerns, as with ethanol, that biodiesel crops will begin to compete with food crops for land in developing countries and raise the price of food. The need for land is the main limitation on expansion of biodiesel production and is likely to limit the scale of the industry. Biodiesel from waste oil and fats will continue to be a small and local source of fuel, while algae-growing shows promise as a sustainable, large-scale biodiesel technology.
It would be impossible to address all possible sources of energy in an overview of this nature. Some potential sources that have been discussed elsewhere in the energy literature include: Ocean thermal, "zero-point" and other "free energy" sources, space-orbiting solar collectors, He4 from the Moon, and methane hydrates. Of these, only methane hydrates has any prospect of yielding commercial amounts of energy in the foreseeable future, and that will depend upon significant technological developments to enable the harvesting of this fragile material. Methanol and Butanol are not discussed here because their properties and prospects differ little from those of other biofuels.
Thus over the course of the next decade or two, society’s energy almost certainly must come from some combination of the 17 sources above.
References
13. Energy Information Administration, Voluntary Reporting of Greenhouse Gases Program http://www.eia.doe.gov/oiaf/1605/coefficients.html
14. Michael T. Klare, Resource Wars: The New Landscape of Global Conflict (New York: Owl Books, 2002).
15. Energy Information Administration (EIA), World Proved Reserves of Oil and Natural Gas, Most Recent Estimates http://www.eia.doe.gov/emeu/international/reserves.html
16. Alternative Fuels Dilemma (reference incomplete; will be updated at final publication)
17. EIA, International Energy Annual 2006, Net Generation by Energy Source (2007), U.S . Energy Consumption by Energy Source (2006) http://www.eia.doe.gov/
18. Alternative Fuels Dilemma
19. Ibid.
20. M. C. Herweyer, A. Gupta, "Unconventional Oil: Tar Sands and Shale Oil", Appendix D, The Oil Drum, 2008, www.theoildrum.com/node/3839
21. World Energy Council (WEC), 2007 Survey of Energy Resources, 93, http://www.worldenergy.org/publications/survey_of_energy_resources_2007/default.asp
22. A. R. Brandt, "Net energy and greenhouse gas emissions analysis of synthetic crude oil produced from Green River oil shale," Energy and Resources Group Working Paper, (University of California, Berkeley, 2006).
23. WEC, 2007 Survey of Energy Resources, 235; EIA, U.S. Nuclear Generation of Electricity, 2007; Renewable Energy Policy Network for the 21st Century (REN21), "Renewables 2007: Global Status Report," 9, http://www.ren21.net/
24. EnergyWatch Group, Uranium Resources and Nuclear Energy, 2006.
25. Robert Powers, "The Energy Return of Nuclear Power," Appendix F, The Oil Drum, 2008, http://www.theoildrum.com/node/3877
26. WEC 2007 Survey of Energy Resources, 272;REN21, "Renewables 2007: Global Status Report," EIA, World Net Generation of Electricity by Type, 2005.
27. WEC 2007 Survey of Energy Resources, 479; Joe Provey, "Wind: Embracing America’s Fastest-Growing Form of Renewable Energy," www.alternet.org/environment/118047/wind:_embracing_america's_fastest-growing_form_of_renewable_energy/
28. Christina L. Archer, Mark Z. Jacobson, "Evaluation of Global Wind Power," J. Geophysical Research: Atmospheres, 2005, http://www.stanford.edu/group/efmh/winds/global_winds.html
29. EIA, "Technology Choices for New U.S. Generating Capacity: Levelized Cost Calculations." International Energy Outlook 2006, http://www.eia.doe.gov/oiaf/archive/ieo06/special_topics.html
30. Ida Kubisewski and Cutler Cleveland, "Energy from Wind: A Discussion of the EROI Research," The Oil Drum, http://www.theoildrum.com/node/1863
31. WEC 2007 Survey of Energy Resources, 381, Ken Zweibel, James Mason and Vasilis Fthenakis, "A Solar Grand Plan", Scientific American, December 2007, http://www.sciam.com/article.cfm?id=a-solar-grand-plan
32. European Photovoltaic Technology Platform, http://www.eupvplatform.org/index.php?id=47
33. Erik A. Alsema and Mariska J. de Wild-Scholten, "Environmental Impacts of Crystalline Silicon Photovoltaic Module Production," 13th CIRP Intern. Conf. on Life Cycle Engineering, 2006, http://www.ecn.nl/docs/library/report/2006/rx06041.pdf
34. Charles A.S. Hall, "The Energy Return of (Industrial) Solar – Passive Solar, PV, Wind and Hydro," Appendix G-2: Photovoltaics, The Oil Drum, http://www.theoildrum.com/node/3910
35. Ibid., Table: EROEI for various PV systems (ranging from commercially available to theoretical), calculated between 2000 and 2008.
36. Graham Jesmer, "The US Utility-scale Solar Picture," Renewable Energy World.com, http://www.renewableenergyworld.com/rea/news/article/2009/02/the-us-utility-scale-solar-picture
37. Ibid.; Tom Standing, "Arizona Solar Power Project Calculations," The Oil Drum, http://www.theoildrum.com/node/4911#more
38. Kallistia Giermek, "The Energy Return of (Industrial) Solar – Passive Solar, PV, Wind and Hydro," Appendix G-1: Passive Solar, Chart: historical timeline of passive solar energy, 5th century to 2006, The Oil Drum, http://www.theoildrum.com/node/3910
39. Ibid.
40. Ibid., Table 1: energy savings at various locations (with date, type and size of building indicated) for the daylighting technique.
41. Ibid.,Table 2: energy savings at various locations (with date, techniques, monetary savings, and cost indicated) for the passive solar heating technique.
42. Ibid.
43. UK Timber Frame Association, "Timber Frame takes the Passivhaus tour," Buildingtalk.com, http://www.buildingtalk.com/news/tim/tim140.html
44. REN21, "Renewables 2007: Global Status Report," http://www.ren21.net
45. Massachusetts Institute of Technology, The Future of Geothermal Energy (Idaho National Laboratory, 2006), http://geothermal.inel.gov/publications/future_of_geothermal_energy.pdf
46. Patrick Hughes, Geothermal (Ground-Source) Heat Pumps: Market Status, Barriers to Adoption and Actions to Overcome Barriers (Oak Ridge National Laboratory ORNL-232, 2008)
47. Daniel Halloran, Geothermal (SUNY-ESF, Syracuse NY), online 2008 http://www.theoildrum.com/node/3949)
48. REN21, "Renewables 2007: Global Status Report," http://www.ren21.net
49. "Energy Source: Tidal Power," The Pembina Institute, http://re.pembina.org/sources/tidal
50. World Energy Council, 1993.
51. WEC 2007 Survey of Energy Resources, 543.
52. Daniel Halloran, Wave Energy: Potential, EROI, and Social and Environmental Impacts (SUNY-ESF, Syracuse NY), online 2008. http://www.theoildrum.com/node/3949)
53. WEC 2007 Survey of Energy Resources, 333.
54. REN21, "Renewables 2007: Global Status Report," http://www.ren21.net
55. "Energy from Biomass," bioenergie.de, http://www.bio-energie.de/cms35/Biomass.393.0.html
56. "FAO Facts & Figures," Food and Agriculture Association of the United Nations, http://www.fao.org/forestry/30515/en/
57. WEC 2007 Survey of Energy Resources, 333.
58. "Net Greenhouse Gas Emissions from Biomass and Other Renewable Generators, USA Biomass, http://www.usabiomass.org/
59. David Ehrlich,"Putting Biogas into the Pipelines," earth2tech.com, http://earth2tech.com/2009/02/03/putting-biogas-into-the-pipelines/, "’Gone Green’ a Scenario for 2020", nationalgrid.com, http://www.nationalgrid.com/NR/rdonlyres/554D4B87-75E2-4AC7-B222-6B40836249B5/26663/GoneGreenfor2020.pdf
60. REN21, "Renewables 2007: Global Status Report," http://www.ren21.net
61. Ibid.
62. Statistics, Renewable Fuels Association, http://www.ethanolrfa.org/industry/statistics/
63. EIA, Petroleum Basic Statistics, http://www.eia.doe.gov/basics/quickoil.html
64. "The Truth about Ethanol," Union of Concerned Scientists, http://www.ucsusa.org/clean_vehicles/technologies_and_fuels/biofuels/the-truth-about-ethanol.html
65. Ibid.
66. "Mexicans stage tortilla protest," BBC News online, http://news.bbc.co.uk/2/hi/americas/6319093.stm
67. Joseph Fargione, Jason Hill, David Tilman, Stephen Polasky and Peter Hawthorne, "Land Clearing and the Biofuel Debt," Science, February 7, 2008, http://www.sciencemag.org/cgi/content/abstract/1152747
68. Richard Lance Christie, "The Renewable Deal: Chapter 5: Biofuels," Earth Restoration Portal, 2008, http://www.manyone.net/EarthRestorationPortal/articles/view/131998/?topic=9481
69. "The Effect of NaturalGradients on the Net Energy Profits from Corn Ethanol", The Oil Drum, http://netenergy.theoildrum.com/node/4910#more
70. Charles A.S. Hall, in comments on "Provisional Results from EROEI Assessments," The Oil Drum, http://www.theoildrum.com/node/3810
71. "Biofuels for Transportation," Worldwatch Institute, 2006, http://www.worldwatch.org/system/files/EBF008_1.pdf
72. REN21, "Renewables 2007: Global Status Report," http://www.ren21.net
73. Cost for biodiesel: reference incomplete; will be updated for final publication.
74. Richard Lance Christie, "The Renewable Deal: Chapter 5: Biofuels," Earth Restoration Portal, 2008, http://www.manyone.net/EarthRestorationPortal/articles/view/131998/?topic=9481
75. Ibid.
76. Rhett A. Butler, "Orangutan should become symbol of palm-oil opposition," Mongabay.com, http://news.mongabay.com/2008/0102-palm_oil.html
77. Jason Hill, Erik Nelson, David Tilman, Stephen Polasky and Douglas Tiffany, "Environmental, economic, and energetic costs and benefits of biodiesel and ethanol biofuels," Proceedings of the National Academy of Sciences, July 25, 2006, Vol 103. http://www.pnas.org/content/103/30/11206.abstract?
78. "Soybean biodiesel has higher net energy benefit than corn ethanol—study," Mongabay.com, http://news.mongabay.com/2006/0711-umn.html
79. "Biodiesel proven to have a significantly positive net energy ratio," Biodiesel Now, http://www.biodieselnow.com/blogs/general_biodiesel/archive/2008/02/07/biodiesel-proven-to-have-a-significant-positive-net-energy-ratio.aspx
80. "Biofuels for Transportation: Global Potential and Implications for Sustainable Agriculture and Energy in the 21st Century," Worldwatch Institute, 2006.
81. Michael Briggs, "Widespread Biodiesel Production from Algae," UNH Biodiesel Group (University of New Hampshire, 2004), http://www.unh.edu/p2/biodiesel/article_alge.html
The author wishes to acknowledge the contributions of Suzanne Doyle to research and the contribution of some writing, to Alina Xu of International Forum on Globalization who compiled a previous summary of data of which this is an expansion, and to Dr. Charles Hall and his students (principally David Murphy) at SUNY-Syracuse, whose work on net energy was the inspiration for this document.
|
|
Bæredygtig økonomi
|
| |
Sustainable Development Commission, UK (April 24, 2008)
A Steady-State Economy
A failed growth economy and a steady-state economy are not the same
thing; they are the very different alternatives we face.
Herman E. Daly
School of Public Policy
University of Maryland
College Park MD 20742 USA
The Earth as a whole is approximately a steady state. Neither the
surface nor the mass of the earth is growing or shrinking; the inflow of
radiant energy to the Earth is equal to the outflow; and material imports
from space are roughly equal to exports (both negligible). None of this
means that the earth is static—a great deal of qualitative change can
happen inside a steady state, and certainly has happened on Earth. The
most important change in recent times has been the enormous growth of
one subsystem of the Earth, namely the economy, relative to the total
system, the ecosphere. This huge shift from an “empty” to a “full” world
is truly “something new under the sun” as historian J. R. McNeil calls it in
his book of that title. The closer the economy approaches the scale of the
whole Earth the more it will have to conform to the physical behavior
mode of the Earth. That behavior mode is a steady state—a system that
permits qualitative development but not aggregate quantitative growth.
Growth is more of the same stuff; development is the same amount of
better stuff (or at least different stuff). The remaining natural world no
longer is able to provide the sources and sinks for the metabolic
throughput necessary to sustain the existing oversized economy—much
less a growing one. Economists have focused too much on the economy’s
circulatory system and have neglected to study its digestive tract.
Throughput growth means pushing more of the same food through an
ever larger digestive tract; development means eating better food and
digesting it more thoroughly. Clearly the economy must conform to the
rules of a steady state—seek qualitative development, but stop
aggregate quantitative growth. GDP increase conflates these two very
different things.
We have lived for 200 years in a growth economy. That makes it
hard to imagine what a steady-state economy (SSE) would be like, even
though for most of our history mankind has lived in an economy in which
annual growth was negligible. Some think a SSE would mean freezing in
the dark under communist tyranny. Some say that huge improvements in
technology (energy efficiency, recycling) are so easy that it will make the
adjustment fun.
Regardless of whether it will be hard or easy we have to attempt a
SSE because we cannot continue growing, and in fact so-called
“economic” growth already has become uneconomic. The growth
economy is failing. In other words, the quantitative expansion of the
economic subsystem increases environmental and social costs faster than
production benefits, making us poorer not richer, at least in highconsumption
countries. And even new technology sometimes makes it
worse. For example, tetraethyl lead provided the benefit of reducing
engine knock, but at the cost spreading a toxic heavy metal into the
biosphere; chlorofluorocarbons gave us the benefit of a nontoxic
propellant and refrigerant, but at the cost of creating a hole in the ozone
layer that protects us from too much ultraviolet radiation. It is hard to
know for sure that growth now increases costs faster than benefits since
we do not bother to separate costs from benefits in our national
accounts. Instead we lump them together as “activity” in the calculation
of GDP.
Ecological economists have offered empirical evidence that growth
is already uneconomic in high consumption countries (see ISEW, GPI,
Ecological Footprint, Happy Planet Index). Since neoclassical economists
are unable to demonstrate that growth, either in throughput or GDP, is
currently making us better off rather than worse off, it is blind arrogance
on their part to continue preaching aggregate growth as the solution to
our problems. Yes, most of our problems (poverty, unemployment,
environmental degradation) would be easier to solve if we were richer--
that is not the issue. The issue is: Does growth in GDP any longer really
make us richer? Or is it now making us poorer?
For poor countries GDP growth still increases welfare, at least if
reasonably distributed. The question is, What is the best thing for rich
countries to do to help the poor countries? The World Bank’s answer is
that the rich should continue to grow as rapidly as possible to provide
markets for the poor and to accumulate capital to invest in poor
countries. The steady state answer is that the rich should reduce their
throughput growth to free up resources and ecological space for use by
the poor, while focusing their domestic efforts on development, technical
and social improvements, that can be freely shared with poor countries.
The classical steady state takes the biophysical dimensions—
population and capital stock (all durable producer and consumer goods)—
as given and adapts technology and tastes to these objective conditions.
The neoclassical “steady state” (proportional growth of capital stock and
population) takes tastes and technology as given and adapts by growth in
biophysical dimensions, since it considers wants as unlimited, and
technology as powerful enough to make the world effectively infinite. At a
more profound level the classical view is that man is a creature who must
ultimately adapt to the limits of the Creation of which he is a part
(finitude, entropy, ecological interdependence). The neoclassical view is
that man, the creator, will surpass all limits and remake Creation to suit
his subjective individualistic preferences, which are considered the root of
all value. In the end economics is religion.
Accepting the necessity of a SSE, along with John Stuart Mill and
the other classical economists, let us imagine what it might look like. First
a caution—a steady-state economy is not a failed growth economy. An
airplane is designed for forward motion. If it tries to hover it crashes. It is
not fruitful to conceive of a helicopter as an airplane that fails to move
forward. It is a different thing designed to hover. Likewise a steady-state
economy is not designed to grow.
Following Mill we might define a SSE as an economy with constant
population and constant stock of capital, maintained by a low rate of
throughput that is within the regenerative and assimilative capacities of
the ecosystem. This means low birth equal to low death rates, and low
production equal to low depreciation rates. Low throughput means high
life expectancy for people and high durability for goods. Alternatively, and
more operationally, we might define the SSE in terms of a constant flow
of throughput at a sustainable (low) level, with population and capital
stock free to adjust to whatever size can be maintained by the constant
throughput beginning with depletion and ending with pollution.
How could we limit throughput, and thus indirectly limit stocks of
capital and people in a SSE? Since depletion is spatially more
concentrated than pollution the main controls should be at the depletion
or input end. Raising resource prices at the depletion end will indirectly
limit pollution, and force greater efficiency at all upstream stages of
production. A cap-auction-trade system for depletion of basic resources,
especially fossil fuels, could accomplish a lot, as could ecological tax
reform, about which more later.
If we must stop aggregate growth because it is uneconomic, then
how do we deal with poverty in the SSE? The simple answer is by
redistribution—by limits to the range of permissible inequality, by a
minimum income and a maximum income. What is the proper range of
inequality—one that rewards real differences and contributions rather
than just multiplying privilege? Plato thought it was a factor of four.
Universities, civil services and the military seem to manage with a factor
of ten to twenty. In the US corporate sector it is over 500. As a first step
could we not try to lower the overall range to a factor of, say, one
hundred? Remember, we are no longer trying to provide massive
incentives to stimulate (uneconomic) growth! Also, since we are not
trying to stimulate aggregate growth, we no longer need to spend billions
on advertising. Instead of treating advertising as a tax-deductible cost of
production we should tax it heavily as a public nuisance. If economists
really believe that the consumer is sovereign then she should be obeyed
rather than manipulated, cajoled, badgered, and lied to.
Free trade would not be feasible for a SSE, since its producers
would necessarily count many costs to the environment and the future
that foreign firms located in growth economies are allowed to ignore. The
foreign firms would win in competition, not because they were more
efficient, but simply because they did not pay the cost of sustainability.
Regulated international trade under rules that compensated for these
differences (compensating tariffs) could exist, as could “free trade”
among nations that were equally committed to sustainability in their
domestic cost accounting. One might expect the IMF, the World Bank, and
the WTO to be working toward such regulations. Instead they vigorously
push both free trade and free capital mobility (i.e., deregulation of
international commerce). Protecting an efficient national policy of cost
internalization is very different from protecting an inefficient firm.
The case for guaranteed mutual benefit in international trade, and
hence the reason for leaving it “free”, is based on Ricardo’s comparative
advantage argument. A country is supposed to produce the goods that it
produces more cheaply relative to other goods, than is the case in other
countries. By specializing according to their comparative advantage both
trading partners gain, regardless of absolute costs (one country could
produce all goods more cheaply, but it would still benefit by specializing in
what it produced relatively more cheaply and trading for other goods).
This is logical, but like all logical arguments comparative advantage is
based on premises. The key premise is that while capital (and other
factors) moves freely between industries within a nation, it does not
move between nations. If capital could move abroad it would have no
reason to be content with a mere comparative advantage at home, but
would seek absolute advantage—the absolutely lowest cost of production
anywhere in the world. Why not? With free trade the product could be
sold anywhere in the world, including the nation the capital just left.
While there are certainly global gains from trade under absolute
advantage there is no guarantee of mutual benefit. Some countries could
lose.
Now comes the problem. The IMF preaches free trade based on
comparative advantage, and has done so for a long time. More recently
the IMF has started preaching the gospel of globalization, which, in
addition to free trade, means free capital mobility internationally—exactly
what comparative advantage forbids! When confronted with this
contradiction the IMF waves its hands, suggests that you might be a
xenophobe, and changes the subject.
The IMF-WB-WTO contradict themselves in service to the interests
of transnational corporations. International capital mobility, coupled with
free trade, allows corporations to escape from national regulation in the
public interest, playing one nation off against another. Since there is no
global government they are in effect uncontrolled. The nearest thing we
have to a global government (IMF-WB-WTO) has shown no interest in
regulating transnational capital for the common good. Their goal is to help
these corporations grow, because growth is presumed good for all—end
of story. If the IMF wanted to limit international capital mobility to keep
the world safe for comparative advantage, there are several things they
could do. They could promote minimum residence times for foreign
investment to limit capital flight and speculation; they could propose a
small tax on all foreign exchange transactions (Tobin tax); and most of all
they could revive Keynes’ proposal for an international multilateral
clearing union that would directly penalize persistent imbalances in
current account (both deficit and surplus), and thereby indirectly promote
balance in the compensating capital account, reducing international
capital movements.
One problem for the SSE already raised by the demographic
transition to a non growing population is that it necessarily results in an
increase in the average age of the population—more retirees relative to
workers. Adjustment requires either higher taxes, older retirement age, or
reduced retirement pensions. The system is hardly in “crisis”, but these
adjustments are surely needed to achieve sustainability. For many
countries net immigration has become a larger source of population
growth than natural increase. Immigration may temporarily ease the age
structure problem, but the steady-state population requires that births
plus in-migrants equal deaths plus out-migrants. It is hard to say which is
more politically incorrect, birth limits or immigration limits? Many prefer
denial of arithmetic to facing either one.
The SSE will also require a “demographic transition” in populations
of products towards longer-lived, more durable goods, maintained by
lower rates of throughput. A population of 1000 cars that last 10 years
requires new production of 100 cars per year. If more durable cars are
made to last 20 years then we need new production of only 50 cars per
year. To see the latter as in improvement requires a change in perspective
from emphasizing production as benefit to emphasizing production as a
cost of maintenance. Consider that if we can maintain 1000 cars and the
transportation services thereof by replacing only 50 cars per year rather
than 100 we are surely better off—the same capital stock yielding the
same service with half the throughput. Yet the idea that production is a
maintenance cost to be minimized is strange to most economists. One
adaptation in this direction is the service contract that leases the service
of equipment (ranging from carpets to copying machines), which the
lessor/owner maintains, reclaims, and recycles at the end of its useful life.
Although the main thrust of reforms for the SSE is to bring newly
scarce and truly rival natural capital and services under the market
discipline, we should not overlook the opposite problem, namely, freeing
truly non rival goods from their artificial enclosure by the market. There
are some goods that are by nature non rival, and should be freed from
illegitimate enclosure by the price system. I refer especially to knowledge.
Knowledge, unlike throughput, is not divided in the sharing, but multiplied.
Once knowledge exists, the opportunity cost of sharing it is zero and its
allocative price should be zero. International development aid should more
and more take the form of freely and actively shared knowledge, along
with small grants, and less and less the form of large interest-bearing
loans. Sharing knowledge costs little, does not create unrepayable debts,
and it increases the productivity of the truly rival and scarce factors of
production. Existing knowledge is the most important input to the
production of new knowledge, and keeping it artificially scarce and
expensive is perverse. Patent monopolies (aka “intellectual property
rights”) should be given for fewer “inventions”, and for fewer years.
What would happen to the interest rate in a SSE? Would it not fall
to zero without growth? Not likely, because capital would still be scarce,
there would still be a positive time preference, and the value of total
production may still increase without growth in physical throughput—as a
result of qualitative development. Investment in qualitative improvement
may yield a value increase out of which interest could be paid. However,
the productivity of capital would surely be less without throughput
growth, so one would expect low interest rates in a SSE, though not a
zero rate.
Would it be possible to have qualitative improvement (e.g.
increasing efficiency) forever, resulting in GDP growth forever? GDP would
become ever less material-intensive. Environmentalists would be happy
because throughput is not growing; economists would be happy because
GDP is growing. I think this should be pushed as far as it will go, but how
far that is likely to be? Consider that sectors of the economy generally
thought to be more qualitative, such as information technology, turn out
on closer inspection to have a substantial physical base, including a
number of toxic metals.
Also, if expansion is to be mainly for the sake of the poor it must
be comprised of goods the poor need—clothing, shelter, and food on the
plate, not ten thousand recipes on the Internet. In addition, as a larger
proportion of GDP becomes less material-intensive, the terms of trade
between more and less material-intensive goods will move against the less
material-intensive, limiting incentive to produce them. Even providers of
information services spend most of their income on cars, houses, and
trips, rather than the immaterial product of other symbol manipulators.
Can a SSE maintain full employment? A tough question, but in
fairness one must also ask if full employment is achievable in a growth
economy driven by free trade, off-shoring practices, easy immigration of
cheap labor, and widespread automation? In a SSE maintenance and repair
become more important. Being more labor intensive than new production
and relatively protected from off-shoring, these services may provide
more employment. Yet a more radical rethinking of how people earn
income may be required. If automation and off-shoring of jobs increase
profits but not wages, then the principle of distributing income through
jobs becomes less tenable. A practical solution (in addition to slowing
automation and off-shoring) may be to have wider participation in the
ownership of businesses, so that individuals earn income through their
share of the business instead of through fulltime employment. Also the
gains from technical progress should be taken in the form of more leisure
rather than more production—a long expected but under-realized
possibility.
What sort of tax system would best fit a SSE? Ecological tax
reform, already mentioned, suggests shifting the tax base away from
value added (income earned by labor and capital), and on to “that to
which value is added”, namely the throughput flow, preferably at the
depletion end (at the mine-mouth or well-head, the point of “severance”
from the ground). Many states have severance taxes. Taxing the origin
and narrowest point in the throughput flow, induces more efficient
resource use in production as well as consumption, and facilitates
monitoring and collection. Taxing what we want less of (depletion and
pollution), and ceasing to tax what we want more of (income, value
added) would seem reasonable—as the bumper sticker puts it, “tax bads,
not goods”. The shift could be revenue neutral and gradual. Begin for
example by forgoing $x revenue from the worst income tax we have.
Simultaneously collect $x from the best resource severance tax we could
devise. Next period get rid of the second worst income tax, and
substitute the second best resource tax, etc. Such a policy would raise
resource prices and induce efficiency in resource use. The regressivity of
such a consumption tax could be offset by spending the proceeds
progressively, by the limited range of inequality already mentioned, and
by the fact that the mafia and other former income tax cheaters would
have to pay it. Cap-auction–trade systems will also increase government
revenue, and auction revenue can be distributed progressively.
Could a SSE support the enormous superstructure of finance built
around future growth expectations? Probably not, since interest rates and
growth rates would be low. Investment would be mainly for replacement
and qualitative improvement. There would likely be a healthy shrinkage of
the enormous pyramid of debt that is precariously balanced atop the real
economy, threatening to crash. Additionally the SSE could benefit from a
move away from our fractional reserve banking system toward 100%
reserve requirements.
One hundred percent reserves would put our money supply back
under the control of the government rather than the private banking
sector. Money would be a true public utility, rather than the by-product of
commercial lending and borrowing in pursuit of growth. Under the existing
fractional reserve system the money supply expands during a boom, and
contracts during a slump, reinforcing the cyclical tendency of the
economy. The profit (seigniorage) from creating (at negligible cost) and
being the first to spend new money and receive its full exchange value,
would accrue to the public rather than the private sector. The reserve
requirement, something the Central Bank manipulates anyway, could be
raised from current very low levels gradually to 100%. Commercial banks
would make their income by financial intermediation (lending savers’
money for them) as well as by service charges on checking accounts,
rather than by lending at interest money they create out of nothing.
Lending only money that has actually been saved by someone
reestablishes the classical balance between abstinence and investment.
This extra discipline in lending and borrowing likely would prevent such
debacles as the current “sub-prime mortgage” crisis. 100% reserves
would both stabilize the economy and slow down the Ponzi-like credit
leveraging.
A SSE should not have a system of national income accounts, GDP,
in which nothing is ever subtracted. Ideally we should have two accounts,
one that measures the benefits of physical growth in scale, and one that
measures the costs of that growth. Our policy should be to stop growing
where marginal costs equal marginal benefits. Or if we want to maintain
the single national income concept we should adopt Nobel laureate
economist J. R. Hicks’ concept of income, namely, the maximum amount
that a community can consume in a year, and still be able to produce and
consume the same amount next year. In other words, income is the
maximum that can be consumed while keeping productive capacity
(capital) intact. Any consumption of capital, manmade or natural, must be
subtracted in the calculation of income. Also we must stop the
asymmetry of adding to GDP the production of anti-bads without first
having subtracted the generation of the bads that made the anti-bads
necessary. Note that Hicks’ conception of income is sustainable by
definition. National accounts in a sustainable economy should try to
approximate Hicksian income and abandon GDP. Correcting GDP to
measure income is less ambitious than converting it into a measure of
welfare, discussed earlier.
The logic of the SSE is reinforced by the recent finding of
economists and psychologists that the correlation between absolute
income and happiness extends only up to some threshold of “sufficiency,”
and beyond that point only relative income influences self-evaluated
happiness. This result seems to hold both for cross-section data
(comparing rich to poor countries at a given date), and for time series
(comparing a single country before and after significant growth in
income). Growth cannot increase everyone’s relative income. The welfare
gain of people whose relative income increases as a result of further
growth would be offset by the loss of others whose relative income falls.
And if everyone’s income increases proportionally, no one’s relative
income would rise and no one would feel happier. Growth becomes like an
arms race in which the two sides cancel each other’s gains. A happy
corollary is that for societies that have reached sufficiency, moving to a
SSE may cost little in terms of forgone happiness. The “political
impossibility” of a SSE may be less impossible than it previously appeared.
|
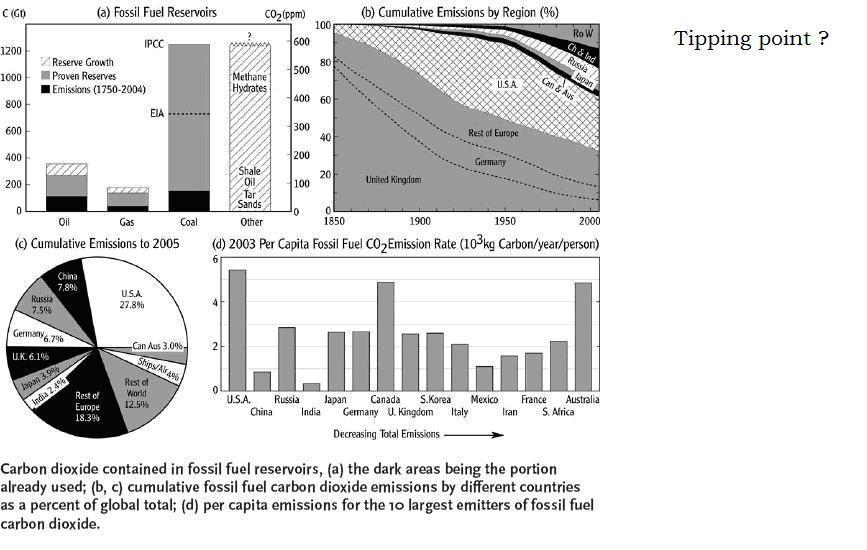
|
|
Kilde: http://a21.dk/blog/2008/05/07/en-klimatologs-perspektiv/ og originalkilde: http://www.columbia.edu/~jeh1/
(Se illustration herover).
7. maj 2008
James Hansen, ledende klimaforsker ved NASAs Goddard Institute for Space Studies har i 2008-2009 State of the Wild bidraget med et yderst læseværdigt essay, Tipping Point. Perspective of a Climatologist, om klimaforandringernes konsekvenser for biodiversiteten. I en kommentar til artiklen Nicholas Stern: 1 ton CO2 til hver, bragte Niels-Holger Nielsen 04.05. i Information en oversættelse af James Hansens essay, som jeg har fået lov at lægge ud på Strøtanker om bæredygtighed.
Tippepunkt, en klimatologs perspektiv
af James Hansen
“Dyrene flygter. Planterne migrerer også.” Jeg skrev disse ord i 2006 for at gøre opmærksom på det faktum, at klimaforandringerne allerede var i gang. Folk bemærker ikke klimaforandringerne, fordi de er skjult af fluktuationer i vejret fra dag til dag, og fordi vi residerer i behagelige hjem. Dyr og planter, på den anden side, kan kun overleve under bestemte klimatiske betingelser, som nu er under forandring. The National Arbor Day Foundation måtte tilbagekalde sine forældede kort over de zoner, indenfor hvilke træarter kan overleve, og dyr skifter til nye bosteder. Er disse gradvise forandringer i naturen i overensstemmelse med de dramatiske videnskabelige vurderinger af, at en planetarisk nødsituation er ved at udkrystallisere sig? Ja, desværre. Forhåndenværende eksempler antyder kun den planetariske nødsituation, som klimastudier afslører med voksende klarhed.
Vores klode er faretruende nær den tærskel, hvor menneskeskabte drivhusgasser når det niveau, hvor væsentlige klimaændringer vil eskalere hovedsagelig ved egen kraft. Igennem intensivering af den hydrologiske cyklus vil opvarmningen forcere skift i klimazonerne, som vil påvirke tilgængeligheden af ferskvand tillige med menneskets sundhed. Vi kommer til at opleve gentagne tragedier langs kysterne i forbindelse med storme og stigende vandstand. Følgevirkningerne er overvældende og kan kun afværges ved, at vi skifter til en fundamentalt anderledes energiproduktion inden for det næste tiår. I modsat fald vil det være for sent for en tredjedel af verdens arter og for millioner af vores egen art.
Vi har mulighed for at bevare denne bemærkelsesværdige planet hvorpå civilisationen udvikledes, men det vil ikke blive let: Særinteresser er modstandere af forandringer og har en uforholdsmæssig magt i vore regeringer, især i USA. Det er essentielt at forstå naturen og årsagerne til klimaændringerne for at kunne skabe løsninger på vores nuværende krise.
Tippepunktet
Jorden opvarmes af sollyset. I ligevægt når den en bestemt temperatur ved at en mængde varme, svarende til den absorberede solenergi, stråler tilbage til rummet. Klimatiske drivkræfter, dvs. forbigående ændringer i Jordens energibalance, påtvinges og ændrer Jordens gennemsnitstemperatur. Drivkræfterne inkluderer solens lysstyrke, vulkanudbrud, som frigiver solreflekterende partikler til stratosfæren og langlivede menneskeskabte drivhusgasser, som holder på varmen.
Drivkræfter forstærker eller svækker afledte ændringer, kaldet feedbackmekanismer, i klimasystemet. Hurtige feedbackmekanismer, som er det umiddelbare svar på temperaturforandringen, forstærker de indledende temperaturændringer og forårsager yderligere opvarmning. Efterhånden som planeten opvarmes betyder hurtige feedbackmekanismer mere vanddamp, der holder på varmen, og mindre is og sne, der efterlader mørke overflader, som absorberer sollyset.
Der findes også langsomme feedbackmekanismer. På grund af opvarmningen spreder skove og kratbevoksning sig mod polerne og ind i tundraområderne. Den ekspanderende vegetation, som er mørkere end tundraen, absorberer sollyset og opvarmer omgivelserne. En anden langsom feedbackmekanisme er den tiltagende fugtighed (mørk farve) på overfladen af iskapperne på Grønland og Vestantarktis i sommermånederne. Til slut vil den kraftige drivhusgas methan boble op efterhånden som tundraen smelter. Palæoklimatiske (klimageologi, nh) vidnesbyrd godtgør at mængden af de langlivede drivhusgasser metan, kuldioxid og kvælstofoxider øges i takt med havenes og landmassernes opvarmning. Disse positive feedbackmekanismer forstærker klimaforandringerne over årtier, århundreder eller endnu længere.
Overvægten af positive feedbackmekanismer forklarer hvorfor Jordens klima i tidens løb har udvist store udsving: Feedbackmekanismer virker i begge retninger, idet de forstærker såvel nedkøling som opvarmning, de er drivkræfter. I fortiden har feedbackmekanismer givet Jordens temperaturkurve et savtakket udseende svingende mellem koldere og varmere klima, endog som svar på selv små ændringer i Jordens hældningsakse.
Det andet fundamentale kendetegn ved Jordens klimasystem, som er forbundet med feedbackmekanismerne, er havenes og iskappernes store træghed. Givet havenes evne til at optage varme, når en drivkraft som fx. en forøget mængde drivhusgasser påvirker den globale temperatur, har kun halvdelen af den endelige overfladeopvarmning vist sig selv efter to til tre årtier. Ændringer i iskapperne foregår også langsomt, dog viser voksende vidnesbyrd at de kan sønderbrydes i løbet af århundreder, eller måske endda årtier.
Kombinationen af træghed og feedbackmekanismer medfører at yderligere klimaforandring allerede er ”i rørledningen”: Selv hvis vi i dag ophørte med at forøge udslippet af drivhusgasser ville yderligere opvarmning indtræffe. Det er tankevækkende, når man overvejer klimaets nuværende tilstand. Den menneskelige civilisation udvikledes i løbet af Holocæn (de sidste 12.000 år), hvor der har været varmt nok til at begrænse iskapperne til Nordamerika og Europa, og koldt nok til at bevare iskapperne på Grønland og Antarktis. Med den hurtige opvarmning på 0,6 grad C, indenfor de sidste tredive år, er den globale temperatur nu højere end på noget andet tidspunkt i Holocæn.
Den opvarmning som allerede er indtruffet, de positive feedbackmekanismer som er sat i bevægelse, og yderligere opvarmning i rørledningen, har tilsammen bragt os til det planetariske tippepunkts afgrund. Vi befinder os på tippepunktet fordi klimaets tilstand indebærer snarlige og store feedbackmekanismer leveret af den arktiske havis, den vestantarktiske iskappe og en stor del af Grønlands is. Kun få yderligere drivkræfter er nødvendige for at udløse disse feedbackmekanismer og forøge den globale opvarmning. Hvis vi træder ud over kanten, vil vi overgå til et miljø langt fra det spillerum, som menneskeheden hidtil har oplevet, og tilbagevenden vil ikke være mulig i en fremtid inden for overskuelige generationer. Ofrene ville inkludere andet end tabet af oprindelige kulturer i Arktis og forsumpning af kystbyer. Den intensiverede hydrologiske cyklus vil forårsage både større oversvømmelser og mere omfattende tørke. I USA vil de halvtørre stater, fra det centrale Texas over Oklahoma til begge Dakotaer, blive mere tørkeudsatte og dårligt egnede til landbrug, for mennesker og for det nuværende dyreliv. Afrika vil opleve voksende udbredelse af tørre områder, især i det sydlige Afrika. Store populationer i Asien og Sydamerika ville miste deres primære ferskvandsforsyninger i den tørre årstid, efterhånden som gletsjerne forsvinder. Den vilde natur vil blive et afgørende offer i denne misere.
Den vilde naturs tilstand
Klimaforandringerne indfinder sig samtidig med, at den vilde natur er stresset af andre påvirkninger – tab af levesteder, for stort jagttryk, forurening og invasive arter - hvilket forøger stresset.
Arterne vil reagere på opvarmningen med forskellig hastighed og påvirke mange andre arter gennem de økologiske vekselvirkningers væv. Dyrs og planters livscyklus, der som regel er årstidsbestemt, kan bryde sammen. Eksempler på cykliske hændelser er blandt andet blades og blomsters udvikling og når dyr bryder op og vandrer, formerer sig eller ligger i hi. For de arter, som er afhængige af hinanden på disse tidspunkter – til bestøvning eller som føde – kan den forskellige hastighed hvormed de reagerer på varmere vejr eller nedbørsændringer forårsage en omsiggribende optrævling af økosystemerne.
Dyr og planter reagerer på klimaændringer ved at udstrække, indskrænke eller skifte udbredelsesområde. Isotermer, som er linier, der trækkes igennem punkter med samme gennemsnitstemperatur, bevæger sig mod polerne med cirka 56 kilometer pr. årti, hvilket betyder at mange arters område må flytter sig i samme tempo. Nogle arter er allerede på vandring: Den røde ræv rykker ind i polarrævens territorium, og økologer har observeret, at 943 arter fra alle klasser og økosystemer har udvist målelige ændringer i deres cykler og/eller udbredelse over de sidste mange årtier. Imidlertid vil deres mulige ruter og habitater blive begrænset af menneskeskabte forhindringer og af andre arters territorier.
Fortsat business as usual-udledning af drivhusgasser truer de mange økosystemer, som tilsammen udgør livets væv på Jorden og tilbyder et bredt spektrum af nytte for menneskeheden. Nogle arter står over for uddøen. De følgende eksempler repræsenterer en håndfuld. Arterne i polaregnene er genstand for særlig bekymring, fordi de er i færd med at blive skubbet af planeten. Adelie- og kejserpingviner er i tilbagegang, efterhånden som vigende havis reducerer rigeligheden af den krill, der er deres føderessource. Arktis’ isbjørne må allerede nu lade sig nøje med den smeltende havis, hvorfra de jager sæler i de kolde måneder. Fordi havisen trækker sig tidligere tilbage for hvert år der går, er isbjørnebestanden i Canada efterhånden formindsket med 20%. Det gælder også antallet af hunner og de kuld de føder. Mens dette skrives overvejer US Fish and Wildlife Service stadig at beskytte isbjørnene; men først efter at være slæbt i retten anklaget for en svigtende indsats på trods af voksende beviser for, at isbjørnen kommer til at lide under den globale opvarmning.
Biologisk forskellige alpine regioner er ligeledes i fare for at blive skubbet af planeten. Når et givet temperaturspand bevæger sig op ad et bjerg, bliver området med netop disse klimatiske forhold mindre og mere klippefyldt, ligesom luften bliver tyndere. Det skærper nogle alpine arters overlevelseskamp.
I det sydvestlige USA overlever det lokale røde mountgrahamegern, men kun på en enkelt bjergtop, en ø i skyerne, en isoleret grøn plet i ørkenen. Beskyttet som udryddelsestruet art nåede bestanden af dette egern et antal på 500 individer, som siden er formindsket til mellem 100 og 200 individer. Tabet af det røde egern vil forandre skoven, fordi dens efterladenskaber er fødekilde og levested for jordegern, studsmus og almindelige mus.
Det røde grahamegern bliver udsat for et nyt klimatisk stress i form af øget varme og tørke og i form af flere brænde. Varmestressede skove er sårbare over for langvarige billeangreb og katastrofebrande. Nedbør forekommer stadig, men er uregelmæssig og voldsom, ligesom tørkeperioderne er mere intense. Det får skovbrandene til at forløbe voldsommere, således at de nedre områder af skoven ikke kan nå at gendannes.
I havets verden lider også den kødædende havskildpadde. Disse store dyr vender tilbage til strandene hvert andet eller tredje år for at begrave en klase æg. Efter to måneder klækkes skildpaddeungerne og skynder sig forsigtigvis til havs, dog kun for at stå ansigt til ansigt med myriader af rovdyr. År med fredning og arbejdet for at beskytte skildpadderne på deres største redeområde, en 32 kilometer lang kyststrækning i Florida, syntes at have stabiliseret bestanden i Sydflorida. Men klimaforandringerne har udsat dem for en ny stresssituation. Floridas strande forsynes i voksende udstrækning med diger, som beskyttelse mod stigende vandstand og storme. Sandstrandene på havsiden af digerne er begrænsede, og kan gå tabt hvis vandstanden stiger betragteligt.
Nogle dyr synes mere tilpasningsdygtige til klimaændringer. Bæltedyret, som er en gammel art, der har eksisteret i mere end 50 millioner år, vil sandsynligvis udstrække sit udbredelsesområde mod nord i USA, men det uudtalte svar på klimatruslen mod det røde grahamsegern og andre arter – fra den brune bjørn, som kan blive nødt til at finde nye føderessourcer i forårsmånederne, til den isolerede snestudsmus i de sydspanske bjerge, er business as usual-afbrænding af fossile brændsler. Forudsagt opvarmning på op til flere grader celsius vil helt sikkert forårsage masseuddøen. Tidligere store varmeperioder i jordens historie, hvoraf den seneste fandt sted for 55 millioner år siden under udledning af store mængder methanhydrater fra Arktis, resulterede i uddøen af halvdelen eller flere af de arter, som dengang fandtes på planeten.
Ville det røde grahamsegern og snestudsmusen kunne overleve, hvis vi transplanterede dem til et højere bjerg? Her vil de være nødt til at konkurrere med andre arter om nicherne i det trævlede net af interaktioner, der har udviklet sig mellem arter og økosystemer. Hvad er udsigten til at vi kunne forstå, endsige genskabe disse komplekse relationer, som skaber økologisk stabilitet? ”Assisteret spredning” har således en tvivlsom fremtid. Den bedste chance for alle arter er menneskets bevidste stræben mod et alternativt energiscenario, som stabiliserer klimaet.
Planetens tilstand
Der er et stort gab mellem hvad, der, i det videnskabelige samfund, er forstået om global opvarmning, og hvad der er forstået om global opvarmning iblandt de, som skal vide: offentligheden og beslutningstagerne.
Den krystalliserende videnskab peger på en truende planetarisk nødsituation. Det farlige niveau for kuldioxid, som vil igangsætte uundgåelige forandringer, er højst på 450 milliontedele (ppm), men kan meget vel vise sig at være mindre. Koncentrationen af kuldioxid er allerede øget fra et førindustrielt (ca. år 1800, nh) niveau på 280 ppm til 383 ppm i 2007, og den vokser nu med ca. 2 ppm om året. For at undgå igangsættelse af en ustoppelig global opvarmning, er vi tvunget til afgørende ændringer inden for 10 år.
Vi må øjeblikkeligt tage vare på kuldioxidudledningen. Den globale industrialisering, først drevet af kul og siden hen af olie og gas, resulterede i en forurening fra fossile brændsler som chokerede London, satte ild til en flod i USA og skadede skovene med syreregn. Vi er ved at løse disse forureningsproblemer, men vi fik ikke has på dem, før de havde ramt os med fuld styrke. På grund af forsinkende effekter, opvarmning som allerede er i rørledningen, og tippepunkter vil ”vente og se”-attituden, med oprydning efter miseren, ikke virke, når det drejer sig om kuldioxidudledningen og klimaændringerne. Hvis vi på den anden side ignorerede udledningerne, ville vi åbne for katastrofale klimaændringer.
[Illustrationen med grafer øverst skal ind her]
I stedet må vi beslutte os for at rykke hurtigt til næste fase af den industrielle revolution, til gavn for avanceret teknologi, atmosfærens opretholdelse og naturens undere. En gennemgang af grundlæggende kendsgerninger om fossile brændsler klargør, hvorfor skiftet snart bør ske. Baseret på den anslåede kuldioxidmængde oplagret i samtlige tilbageværende forekomster – medregnet olie, gas, kul og ukonventionelle brændsler i form af tjæresand, tjæreskifer, tung olie og methanhydrater – ville alene afbrændingen af olie- og gasressourcerne få kuldioxidindholdet til at stige til 450 ppm. Tillige at afbrænde kul og ukonventionelle fossile brændsler, som det allerede planlægges af energiselskaberne, ville bringe kuldioxidniveauet langt højere op.
For at forstå begrænsningerne mht. fremtidig anvendelse af fossile brændsler, er det nødvendigt at være opmærksom på kulstofkredsløbet. Dette er kendetegnet ved, at havet straks absorberer en del af kuldioxidudslippet, og at det efterhånden vil ske langsommere, når mere optaget kuldioxid udøver et ”modpres” (mætning, nh). Yderligere optag af kuldioxid er afhængig af opblandingen med det dybe ocean og af udfældningen i sedimenter på havets bund. Det betyder, at cirka en tredjedel af kuldioxidudslippet forbliver i atmosfæren i hundrede år og kun er reduceret til en fjerdedel efter 500 år. Kuldioxid, stadig til stede i atmosfæren fra den industrielle revolution, pålægger således Europa og USA en tung skyld. Kulstofreservoirerne og havets evne til at transportere kuldioxid er vigtige grænsebetingelser når vi skal finde løsninger på klimakrisen. Vi kan kun afværge planetariske ændringer – sluttelig sønderbrydning af iskapperne og masseuddøen – hvis den planetariske energibalance bliver genskabt ved en acceptabel globaltemperatur. Temperaturer skifter fra år til år, men øges gennemsnitligt med 0,2 grad C pr. tiår. Selvom vores vurderinger af tilladelig opvarmning vil blive raffineret efterhånden, som vores viden forøges, viser udfaldet af velbegrundet videnskab, at den ”sikre” globale temperatur ikke bør ligge højere end 1 grad C over den globale temperatur i år 2000.
Denne grænse, for yderligere opvarmning, på en grad svarer til den ovennævnte ramme på ca. 450 ppm. At bestemme kuldioxidrammen mere præcist er kompliceret på grund af andre menneskeskabte drivkræfter, specielt methan, kvælstofoxider og ”sort sod”. Et alternativt scenario, som har været foreslået, tillader fx. kuldioxidindholdet at toppe ved 475 ppm, fordi det tillige forudsætter store methanreduktioner. Dog vil mængden af menneskeskabte svovlaerosoler (reflektive partikler med stærkt kølende effekt (fra kulafbrænding, nh)) sandsynligvis formindskes og herved ophæve de anslåede methanreduktioner. Derfor er 450 ppm en god tilnærmelse for det højest tilladelige CO2-tryk. Faktisk kan det være for højt sat, hvis det nylige istab på Antarktis er skriften på væggen.
Eftersom vi risikerer at nå de 450 ppm inden for tyve til tredive år, burde vi være inspireret til at ændre vores energisystemer. Baseret på de herskende grænsebetingelser er det følgende en firepunktsstrategi for at undgå klimaforandringer.
1. Brug af kul og ukonventionelle fossile brændsler må begrænses til de tilfælde hvor kuldioxiden indfanges og opbevares i geologiske formationer. De eksisterende kulkraftværker skal udfases over de nærmeste årtier.
2. En pris på kul og effektivitetsstandarder skal indføres. Idet vi anerkender de fossile brændslers usædvanlige koncentration (tilgængelighed, nh) og mobilitet, som næsten ingen andre energiformer kan konkurrere med, består den praktiske vej mod en æra hinsides fossile brændsler i at indføre en moderat, men stigende kulpris. Etableringen af denne pris kan ske ved en beskatning af fossile brændsler eller ved et system med rationering og omsættelige udledningskvoter, som begrænser ofrene for de, der har dårligst råd. Eller ved en kombination af de to metoder. Dette vil lade fossile brændsler betale for de miljømæssige skader, mens den resterende gas og olie strækkes til at imødekomme bæredygtig økonomisk vækst. Visheden om stigende priser vil inspirere industrien til fornyelser og reducere tilbøjeligheden til at udnytte ukonventionelle fossile brændsler med højt kuldioxidudslip, som fx tjæreskifer. Dertil behøver vi reelle effektivitetsstandarder for køretøjer, bygninger og belysning. Vi er nødt til at fjerne barriererne for energieffektivitet, som fx. de fleste apparatfabrikanters politik med at fremme energikonsumption frem for besparelser.
3. Vi er tvunget til at tage skridt mod at trække kuldioxid ud af atmosfæren. Land- og skovbrugsmetoder, som forøger tilbageholdelsen af kul i jorden og i biosfæren skal støttes. Biobrændselsanlæg med kuldioxidrensning kan trække den menneskeskabte kuldioxid ud af atmosfæren og begrave den under jorden. Kuldioxid kan opbevares under havsedimenter og på andre geologisk sikre lokaliteter.
4. Vi må tage skridt til, ved hjælp af streng regulering, at reducere andre forstærkninger end kuldioxid, især ”sort sod”, methan og ozon ved jordoverfladen.
International implementering af disse forholdsregler kræver indrømmelse af ansvar. På grund af den lange levetid som kuldioxid har i atmosfæren, bærer Europa et stort ansvar. Men USA’s ansvar er mere end tre gange så stort som nogen anden nations, og vil vedblive at være det største ansvar i endnu adskillige årtier, selvom Kina vil overgå USA i udledningsvækst inden for et par år.
Desværre er forudsætningerne for at undgå globale katastrofer ikke bredt accepteret: Tyskland har tænkt sig at erstatte atomkraftværker med kul. Men Europa, USA og andre udviklede lande burde vedtage et moratorium for nye kulfyrede kraftværker indtil kulfiltrering og opbevaring er på plads. Dette kan ikke vente til lignende restriktioner er praktisable i Kina og Indien. Vores ansvar for klimaforandringer og per capita-udledninger i USA, Canada og Australien er i særklasse sammenlignet med Indiens og Kinas og fastlægger de moralske forpligtelser.
Samtidig burde Kina og andre udviklingslande bulldoze forældede kulkraftværker og erstatte dem med udelukkende den nyeste teknologi. Storme og oversvømmelser forårsaget af klimaforandringer vil ramme udviklingslandene hårdest, fordi de fleste megabyer nær ved havets overflade er beliggende i disse lande. Dette faktum skulle give Kina og Indien incitament til at få styr på klimaforandringerne.
Energieffektivitet i fremtidens køretøjer er også vital. Californiens krav om 30% forbedring af energieffektiviteten er værdifuld. Modsat gør en foreslået energiplan, der kræver 20% bioethanol, hovedsageligt udvundet af majs, blandet i bilbrændstoffet, mere skade end gavn. Den vil kun bidrage lidt til reduktion af udslippene, fordi ethanolproduktionen er meget energikrævende og forringer kulstofs binding i jorden. Der findes måder, hvorpå vedvarende eller andre CO2-fri energiformer ville kunne drive køretøjer, men halve løsninger burde ikke dikteres uden passende videnskabelig indsigelse til at afbalancere de agroindustrielle kapitalinteresser.
Under den forudsætning kan biobrændstoffer spille en vigtig rolle i vores energifremtid. Som indfødt fra Iowa holder jeg af at forestille mig Midtvesten undsætte medborgere, som er truet af de stigende verdenshave. Lokale græsser, evt. forbedrede sorter, vil, dyrket på passende måde, kunne trække CO2 ud af atmosfæren. Prærierne kunne bidrage, hvis vi hastede med at løse klimaproblemerne inden de rammes af supertørken. Investeringer og forskning i biobrændsler bør fortsætte, men med deltagelse af videnskabs- og fredningsfolk, da visse regerings- og industriplaner for produktion af biobrændsler kun vil resultere i mere skovrydning til olie- og sojaplantager med deraf følgende konsekvenser for naturen.
Et afsluttende billede
Jordens palæoklimatiske vidnesbyrd fortæller os, at atmosfæriske drivhusgasser nu er tæt på det farlige niveau, hvor tippepunkter bliver uundgåelige. Vi kan vælge et spor, hvor vi vender drivhusgassernes vækst, og straks ændrer vores energistrategier. Det var et skridt i den rigtige retning da USA’s højesteret besluttede, at Miljøbeskyttelseskontoret kan og skal regulere udslippet af drivhusgasser. Uanset hvad, så er langt mere nødvendigt.
Som jeg ser det, har særinteresser udøvet en utilbørlig magt over vores regeringer, og således fremmet minimalistiske foranstaltninger og vækst i brug af fossile brændsler, snarere end tilvejebringelse af de nødvendige investeringer.
USA’s regerings medskyldighed i forhold til særinteresser blev tydelig da, under en arbejdende konference afholdt af NASA om arktisk havis, et medlem af min gruppe foreslog, at en reduktion i udledningen af drivhusgasser kunne modvirke tab af havis. Hans antagelse provokerede en ministeriel støttepædagog til at proklamere at ”dette er uacceptabelt,” fordi det er et politisk standpunkt, selvom det beviseligt var videnskabeligt baseret. Mens udøvelse af politisk virksomhed er vore valgte repræsentanters ret, havde videnskabsfolk brugt tiden på at forbinde knudepunkterne i klimaforskningen, men blev forhindret i at kommunikere denne erkendelse. I dette tilfælde udgjorde kapitalinteresser en trussel mod vores hjemplanet og det livets væv, der bebor den.
Det er værd at forestille sig hvordan vores børnebørn ville kigge tilbage på os. Det billede, jeg frygter, viser forurenerne, forsyningsvirksomhederne og automobilfabrikanterne stående i retten, hvor de kræver tilladelse til fortsat udledning af kuldioxid med henblik på sikring af kortsigtet profit. Det foruroligende ved billedet er, at vi, repræsenteret ved vores regering, officielt er imod forurenerne - som en stor amicus curiae (rettens ven) - og dog argumenterer imod begrænsning af udledningerne. Er det dette billede af vores generation, som vi ønsker at blive husket for?
Vi lever i et demokrati, og politikken repræsenterer vores kollektive vilje. Hvis vi tillader, at planeten krydser tippepunkter, vil det blive svært at forsvare vores rolle. Den vilde naturs tilstand ligger i vore hænder, og vi kan stadig nå at beskytte skaberværket og tjene hele menneskeheden. Et fremstød for energieffektivitet og rene energikilder vil producere high-tech jobs. Genopretning af ren luft vil blive hilst velkommen overalt. Livet på landet såvel som på planeten kunne drage fordel af intelligent udvikling af biobrændsel og fornybar energi.
I frontlinien befinder miljø- og fredningsfolk sig, hvor de observerer naturen og tjener som stemme for planter og dyr, der allerede reagerer på opvarmningen. For at bevare så stor en biodiversitet, som over hovedet muligt, er det nødvendigt at frednings- og miljøfolk forener sig med mange andre for at fremme en langt mere radikal reduktion i udledningen af drivhusgasser, end det hidtil har været anset for praktisk muligt at opnå. I modsat fald vil alpine og polare arter, koralrev og de arter, som lever i områder, der vil blive ramt af udtørring, forsvinde i løbet af det næste århundrede.
Oversættelse, Niels-Holger Nielsen
James Hansen: Tipping Point. Perspective of a Climatologist State of the Wild 2008-2009 pp. 6-17 (pdf).
Jørgen Steen Nielsen: Nicholas Stern: 1 ton CO2 til hver, Information 03.05.2008.
James Hansen er siden på baggrund af analyser af havbundsprøver kommet til det resultat, at selv en stabilisering af atmosfærens CO2-indhold på 450 ppm vil føre til, at klodens ismasser gradvist smelter. Han siger på den baggrund, at vi må sigte på at nå med på 350 ppm, altså lavere end den nuværende CO2-koncentration på 385 ppm (se tidligere blog-indlæg: NASA-forskere varsler havstigninger på op til 75 meter) og meget lavere end IPCCs anbefalinger af, at vi må sigte på at stabilisere CO2-indholdet på 550 ppm.
|
|
Connie Hedegaard 26. marts 2008
|
| |
Vi skal frem - bæredygtigt
26. marts 2008
Af: Connie Hedegaard, Klima- Og Energiminister (K)
På sigt skal Danmark være helt uafhængig af fossile brændstoffer. Frem mod 2050 skal vi have et samfund, hvor vi udleder 60-80 procent færre drivhusgasser end i dag. At nå derhen er ingen let opgave, og derfor har regeringen nedsat Klimakommissionen, hvor en gruppe eksperter skal finde løsninger på udfordringen.
I Information 11. marts anholder Jørgen Stig Nørgaard så, at regeringen har sat som forudsætning for kommissionens bud på løsninger, at det skal være muligt at have økonomisk vækst i samfundet. Naturligvis, må man sige. Det ville ikke være nogen kunst at svare på, hvordan man kan reducere CO2-udslippet med 60-80 procent, hvis man ikke skulle tage samfundet i øvrigt med i overvejelserne. Så kunne man jo i princippet blot indføre et forbud mod industriproduktion i Danmark. Eller forbyde alle danskere at have bil.
Det er ikke den vej, vi skal. Vi skal sikre et samfund, der er i stand til at udvikle sig samtidig med, at vi tager de hensyn til miljø og klima, som er så afgørende for, at vi også er i stand til at udvikle os i fremtiden. Fordi vi ikke slider for hårdt på ressourcerne. Fordi der skal være en rig flora og fauna til vores børn og børnebørn. Fordi vi ikke i det rige vesten sviner ubegrænset, mens skaderne viser sig i udviklingslande eller ved polerne.
Når Jørgen Stig Nørgaard taler om, at vækst og forurening går hånd i hånd, taler han ud fra et forældet verdensbillede. I Danmark har vi netop vist, at det er muligt at afkoble de to: Siden starten af 1980'erne har Danmark haft en økonomisk vækst på omkring 70 procent - og samtidig har energiforbruget været stort set konstant. Det er jo netop det, der er ændret fra dengang Rav-Åge kæmpede mod giftdepoterne på Harboøre Tange: Netop afdøde Rav-Åge, som Ejvind Larsen bringer i spil andetsteds i avisen, var ikke imod Cheminovas vækst og arbejdspladser. Han var imod, hvad han kunne se, fabrikkens udledninger gjorde mod havet, når fiskene skvulpede rundt i brændingen med bugen i vejret.
Når det så er sagt, er det klart, at klimaudfordringen må mane til en vis form for omtanke i forhold til materielle goder. Men det er jo et luksussynspunkt i forhold til de milliarder af klodens indvånere, der stadig ikke har fået opfyldt selv de mest elementære behov. Hvad vil Jørgen Stig Nørgaard f.eks. sige til de 500 millioner indere, der endnu ikke har fået elektrisk lys? Eller til den milliard kinesere, der stadig drømmer om at få del i middelklassens velstand? Og til de hundreder af millioner af afrikanere, der endnu lever i fattigdom? Skal vi ikke have vækst til dem? For mig er det indlysende, at også fremtiden byder på vækst. At tro vi kan stoppe den er ikke bare utopi. Det er også amoralsk. Derfor er opgaven - og kunsten - at skabe bæredygtig vækst. Både i Danmark og resten af verden. Og det skal klimakommissionen naturligvis forholde sig til.
Se kommentarer til denne artikel under Nyhedsblog
|
|
IDA har tænkt
|
| |
Godt nogen tænker!
IDA (Ingeniørforeningen i Danmark) har tænkt og udgivet en energiplan for Danmark, der rækker et stykke frem i tiden.
Her er linket til rapportenl: http://ida.dk/Arrangementer/Energiaar+2006/Afslutningskonference+-+Energiplan+2030.htm
IDA’s 11 centrale anbefalinger i uddrag
1. Forlængelse af energispareaftalen til og med år 2030
Energispareaftalen, der lægger op til en årlig besparelse på 1,7 % af energiforbruget, og som løber frem til 2013, bør forlænges til og med år 2030.
2. Oprettelse af en industrisparefond
Der er store samfundsøkonomiske gevinster at hente ved at nedbringe industriens energiforbrug. Derfor bør der sættes særligt fokus på dette område. Fondens budget bør årligt udgøre 800 mio. kr.
3. Oprettelse af en varmesparefond
Der er store besparelsespotentialer i den eksisterende bygningsmasse, men der mangler en central instans, som kan realisere dette besparelsespotentiale. En varmesparefond bør have et årligt budget på 1 milliard kr. Elsparefondens årlig budget udvides med 210 millioner kr., således at deres budget årligt er 300 millioner kroner.
4. Over de næste 30 år bør der investeres 200 milliarder kroner i den offentlige banetransport
Det er afgørende at forbedre den kollektive banetransport med henblik på at nedsætte energiforbruget til transport.
5. En milliard kroner til forskning, udvikling og demonstration
Midlerne til forskning, udvikling og demonstration på energiområdet bør øges fra de nuværende ca. 350 millioner kroner årligt til mindst 1 milliard kroner årligt. Dette er afgørende for, at energiområdets store erhvervspotentialer kan indfries. Midlerne bør øremærkes til energispareteknologier og vedvarende energiteknologier.
6. Innovationsmarkeder - en mistbænk for markedsmodning af nye teknologier
Det er afgørende, at der etableres udviklingsvilkår, som sikrer, at nye teknologier, der har nået et stade, hvor de fungerer teknisk, men som endnu ikke kan konkurrere på eksisterende markedsvilkår, mrkedsmodnes.
7. Forureningsomkostninger mv. bør inkluderes i markedsprisen gennem faste afregningspriser (feed-in tarif’er) for vedvarende energi (VE)
”Forureneren betaler” princippet bør gennemføres på energimarkederne.
8. Vitaminindsprøjtning til det folkelige engagement og medejerskab
En gennemførelse af Ingeniørforeningens Energiplan 2030 kan kun lade sig gøre ved folkelig opbakning, engagement og medejerskab.
9. Danmark bør arbejde for at CO2-kvoter bortauktioneres
Uddeling af gratis CO2-kvoter strider mod ”forureneren betaler” princippet. Uddelingen udgør indirekte en kapitaltilførsel til den fossile energiproduktion og er derfor medvirkende til at fastholde denne produktion. Danmark bør vælge at bortauktionere de 10 % af CO2-kvoterne, som EU tillader. Der bør samtidig arbejdes på, at man på EU-niveau vedtager, at CO2-kvoterne for fremtiden ikke uddeles gratis, men bortauktioneres.
10. Serviceeftersyn af hele afgifts- og tarifsystemet på energiområdet
En række afgifter virker i dag ikke efter hensigten, er forældede, eller understøtter direkte en ikke bæredygtig udvikling.
11. Etablering af 100 % vedvarende energiby
Ingeniørforeningens Energiplan 2030 rummer store erhvervspotentialer og eksportmuligheder. Når potentialer skal omsættes til teknologiudvikling og eksportordrer, kræver det, at Danmark placerer sig på verdenskortet, når det gælder vedvarende energi. Danmark bør derfor etablere en 100 % vedvarende energiby. Der bør afsættes ½-1 milliard kr. fordelt over 10 år til offentlig medfinansiering af et sådant projekt.
Finansiering
De foreslåede initiativer, der er målrettet energibesparende tiltag og udvikling af nye vedvarende energiteknologier, vil samlet kræve en ekstra offentlig finansiering svarende til godt 2,7 milliarder kroner årligt. Heri er ikke medregnet udgifter forbundet med oprettelse af innovationsmarkeder og indførsel af ”feed-in tarif’er”. Herudover forslås det, at der over de næste 30 år investeres 200 milliarder kroner i udviklingen af banetrafikken. Investeringen er blandt andet nødvendig for at imødegå yderligere tab som følge af trængselsproblemer i trafikken. Samtidig vil investeringen bidrage væsentligt til en reduktion af energiforbruget til transport.
Det vil være oplagt at bruge en del af ekstraprovenuet fra Nordsøolien til at finansiere planens anbefalinger. Årligt bidrager indtægterne fra Nordsøen med mere end 30 milliarder kroner til den danske statskasse. Udgifterne til såvel investeringer i bane, energibesparende tiltag, samt udvikling af nye vedvarende energiteknologier vil årligt udgøre under en tredjedel af indtægterne fra Nordsøen. Derudover bør provenuet fra salg af CO2- kvoter anvendes til at finansierer de forslåede initiativer.
Ingeniørforeningens Energiplan 2030 anbefaler, at Danmark, der i disse år står i en historisk stærk position med et betydeligt overskud på betalingsbalancen, vælger at investere offensivt i fremtidens infrastruktur.
|
| |
Olieforbruget
Olieforbruget i 2005 forventes at blive 83,3 mb/d og i 2006 85,0 mb/d
Globalt olieforbrug fra 2004 til 2006
År: 2004 2005 2006
Mb/d 82.2 83.3 85.0 (millioner barrels pr. dag)
Årlig ændring (%) 3.7 1.5 2.0
1 barrel er er ca. 159 liter
Kilde IEA http://omrpublic.iea.org/
|
|
Energi
Læs Teknologirådets nyhedsbrev fra Rådet til Tinget nr. 199, der hedder "Danmark i globalt spil om energi. Fremtidens samfund afgøres nu og energi bør spille en hovedrolle".
Læs også nr. 195 "Før havet stiger".
Find dem under Internet links.
August 2005
|
| |
Hvor meget olie er der?
På basis af data fra 2007 er svaret:
Vurderede reserver: 1.292.600.000.000 barrels (US: 1.293 billion/DK: 1.293 milliarder)
Verdens forbrug: 82 millions barrels pr. dag
Så længe varer det: Olie til 15.763 dage eller ca. 43 år ved uændret forbrug.
Hvis forbruget stiger, hvad der kan forventes, vil olien række til færre år.
US Geological Survey vurderer, at mængden af olie, som stadig kan findes er omkring 3 gange de kendte oliereserver, men det er uvist om denne olie rent faktisk kan pumpes op til overfladen og bruges. Det gode spørgsmål er, hvornår produktionen vil være utilstrækkelig til at dække efterspørgslen.
Et og andet vil der ske i den situation.
Det er helt tåbeligt at lade fremtiden bero på, at billig og lettilgængelig olie er til rådighed og det er helt tåbeligt - på alle niveauer, fra den daglige køretur til bageren og til oliesvineriet på formel-1 banerne, og alle andre steder, hvor der bruges olie - at svine med denne ressouce, som det sker i øjeblikket. Den må stilles til rådighed for den største omstillingsproces til bæredygtighed noget samfund har oplevet - for at sikre, at det overlever som et sted, hvor fremtidens generationer kan leve et godt liv.
1 barrel er ca. 159 liter.
Februar 2008.
Kilde http://www.scaruffi.com/politics/oil.html
|
|
|
|
|
|
|